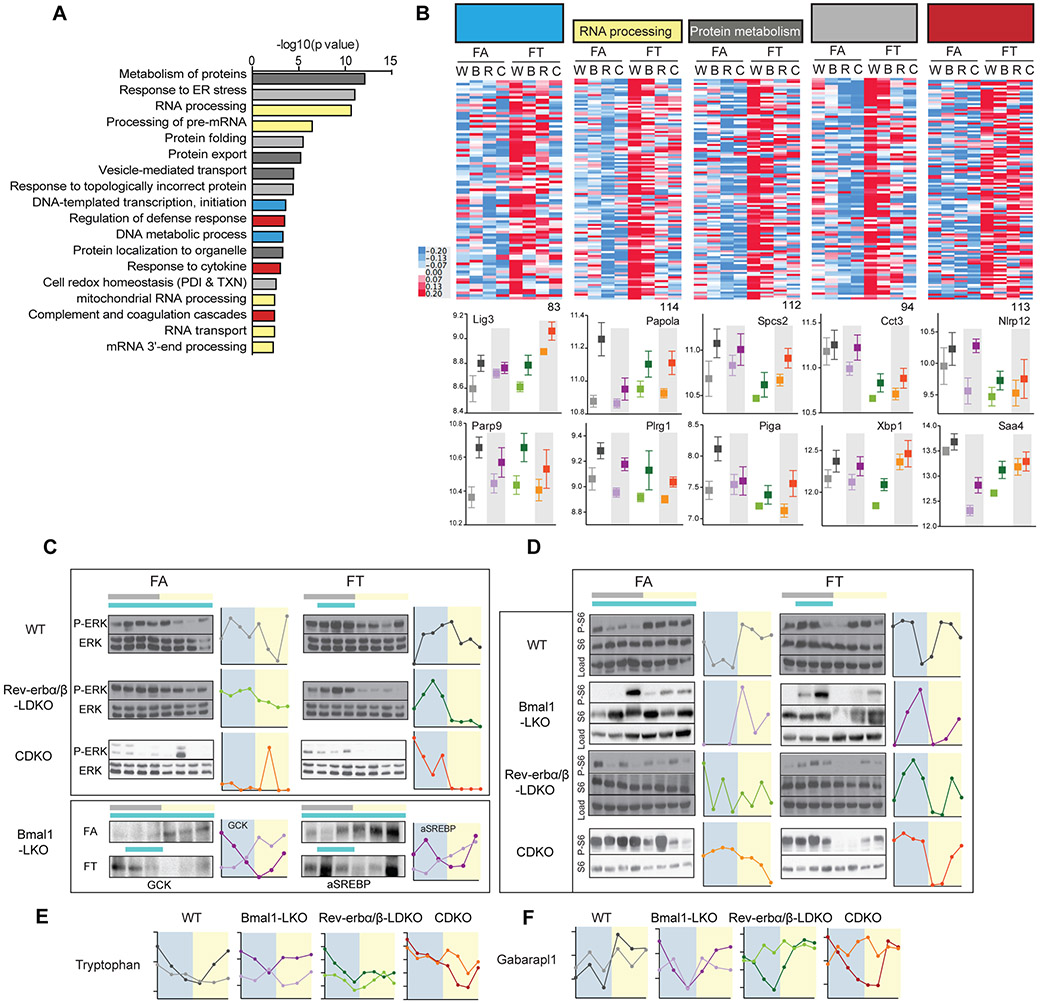
Figure 7: Liver function is preserved in TRF and diurnal rhythms in nutrient sensing pathway is preserved in all clock mutants on TRF.
A. Pathway enrichment analysis results of 2142 genes that are significantly higher in TRF. Related pathways are colored similarly.
B. Heatmap representation of the expression levels of the significant genes in TRF belonging to DNA metabolism and transcription (83 genes, blue bars in 7.A.) (ii) RNA processing (114 genes, yellow bars in 7.A.), (iii) Protein metabolism (112 genes, dark grey bars in 7.A.), (iv) Protein folding and unfolded protein response (94 genes, light grey bars in 7.A.), and (v) Defense response and coagulation (113 genes, red bars in 7.A.) and selected individual expression profile (below).
C-D. Representative western blot and graphical representation of the quantification (ImageJ) of the temporal expression profile of (C) phospho-ERK/ERK, GCK and active SREBP (cleaved form) and (D) the phosphorylated ribosomal protein S6 (P-S6), in the liver of clock deficient mice and control in FA versus FT as indicated.
E. Diurnal levels of the metabolite tryptophan in the liver of clock deficient mice and control in FA versus FT as indicated.
F. Diurnal levels of Gabarapl1 expression in the liver of clock deficient mice and control in FA versus FT as indicated.

