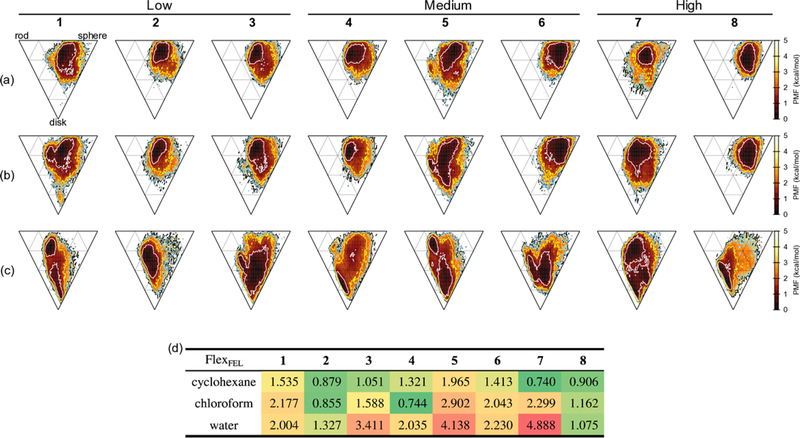
Figure 5.
FEL of molecular shape at T = 300 K for each compound and solvent. Each vertex, top left, top right and bottom represents a rod, sphere and disk, respectively. Annotated above for the permeability class defined in Table 1. (a) is in cyclohexane, (b) in chloroform, and (c) in water. The contour lines for PMF = 1.0, 2.0, 3.0, and 4.0 kcal/mol are plotted as white, yellow, sky-blue, and black lines, respectively. (d) FlexFEL values for each compound and solvent defined by the molecular shape plane.

