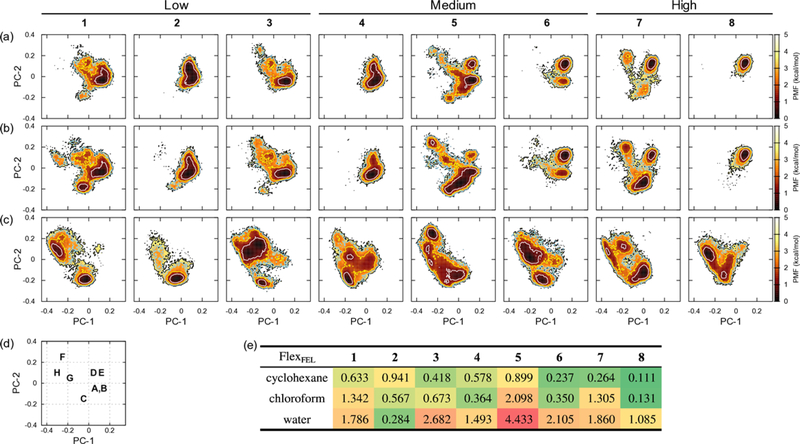
Figure 6.
FEL by PCA axis PC-1 vs. PC-2 at T = 300 K for each compound and solvent. Annotated above for the permeability class defined in Table 1. (a) is in cyclohexane, (b) in chloroform, and (c) in water. The contour lines for PMF = 1.0, 2.0, 3.0, and 4.0 kcal/mol are plotted as white, yellow, sky-blue, and black lines, respectively. (d) A representative box showing the locations of each pattern. See main text for details. (e) FlexFEL values for each compound and solvent defined by PC-1 and PC-2 planes.

