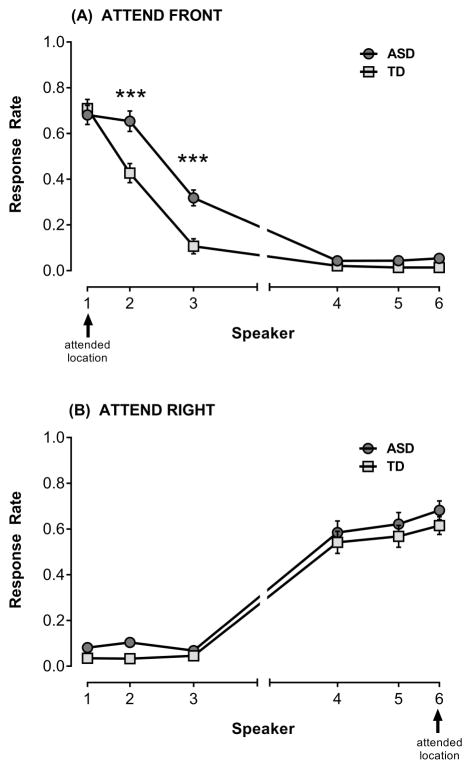
Figure 3.
Mean proportion responses (i.e., response rate) ± SEM to oddball stimuli at each speaker collapsed across stimulus type, where response rate at target represents hits and response rate at peripheral speakers are false alarms. The drop-off in responding from target to distant speakers represents the spatial attention gradient. (A) Attend Front condition (target=S1), (B) Attend Right condition (target=S6). Only group differences in mean response rates at speakers that were significant after correcting for multiple comparisons are indicated, ***p<.001.

