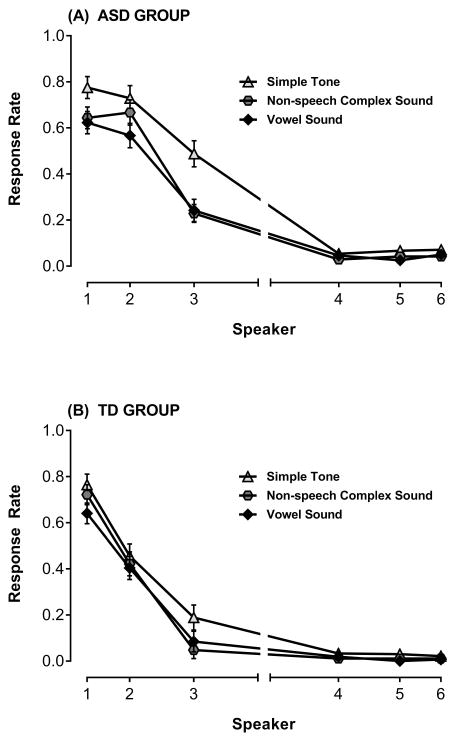
Figure 4.
Mean proportion responses (i.e., response rate) ± SEM to oddball stimuli at each speaker in the Attend Front condition for each of the three stimulus types (simple tone, non-speech complex sound, vowel sound), separately for the (A) ASD group and (B) TD group. Response rate at target speaker represents hits and response rate at peripheral speakers are false alarms. Though there is a main effect of stimulus type overall (higher response rates to the simple tone), the key finding is that the pattern of the spatial attention gradient was similar across stimulus types, and across groups.

