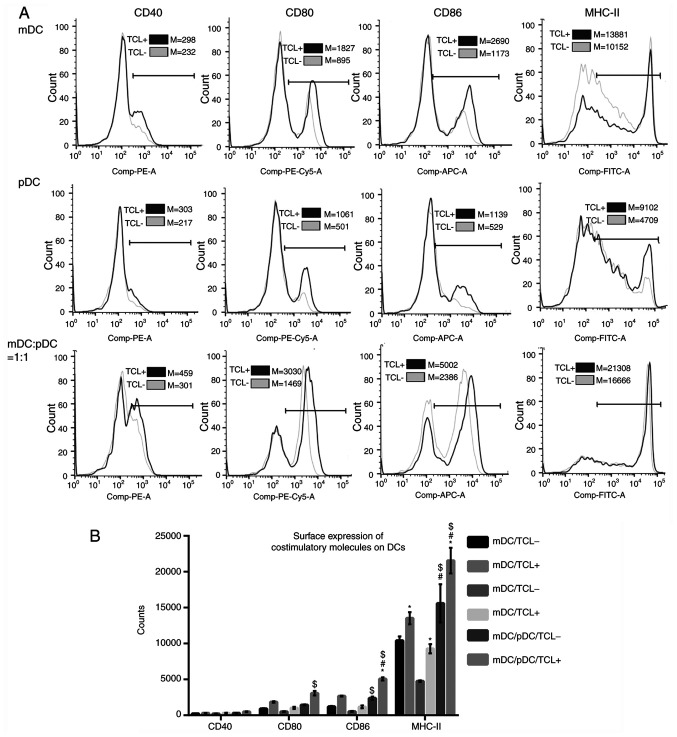
Figure 3.
Surface expression of costimulatory molecules. (A) Flow cytometry results and (B) quantification. Data were analyzed using a two-way ANOVA with Sidak's post hoc test. *P<0.05 vs. the same cell type without tumor lysate treatment. #P<0.05 vs. mDC group. $P<0.05 vs. pDC group with the same treatment (with or without tumor lysate). m, myeloid; p, plasmacytoid; DCs, dendritic cells; TCL-, without heat-treated tumor cell lysate; TCL+, loaded with heat-treated tumor cell lysate.

