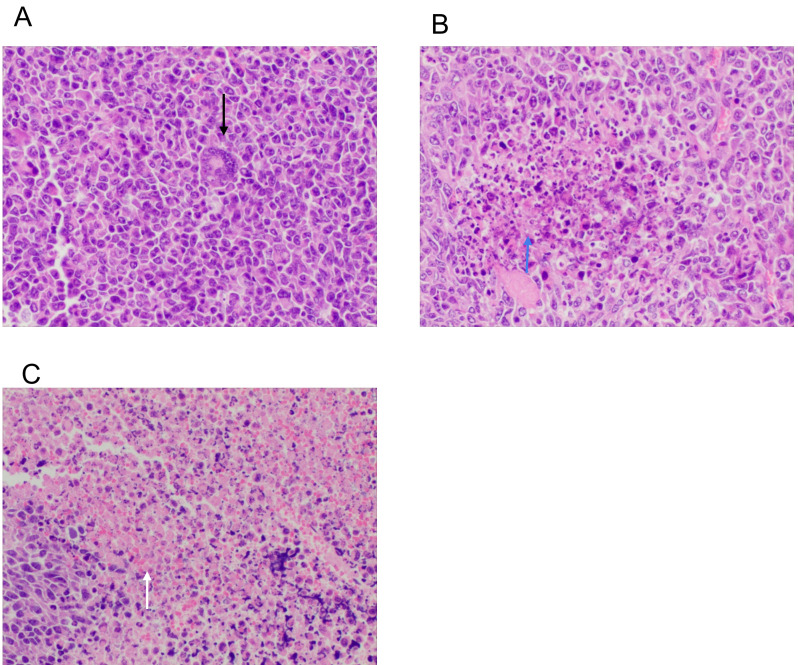
Figure 6.
Hematoxylin and eosin staining of tumor tissue of (A) the control, (B) mDC and (C) mDC+ plasmacytoid DC groups. Black arrow indicates the tumor cells with obvious atypia. Blue arrow indicates focal necrosis and hemorrhage, while arrow indicates massive necrosis and hemorrhage. Magnification, ×200. m, myeloid; DCs, dendritic cells.

