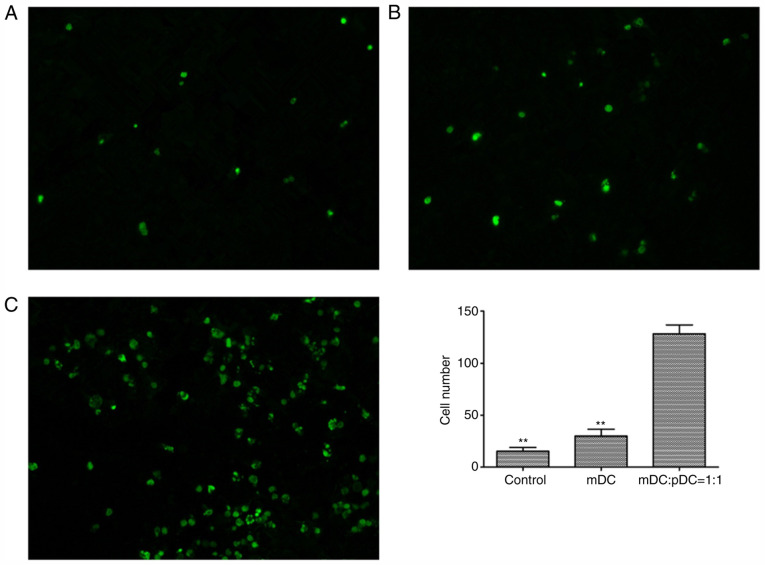
Figure 7.
TUNEL staining of tumor tissue of the (A) control (A), (B) mDC (B) and (C) mDC+pDC groups. Magnification, ×200. Three fields were observed for each group. (D) The number of tumor cell apoptosis in the mDC: pDC=1:1 group was significantly higher than that in the mDC and Control groups. One-way ANOVA with Sidak's post hoc test. **P<0.01 vs. the mDC+pDC group. m, myeloid; p, plasmacytoid; DCs, dendritic cells.

