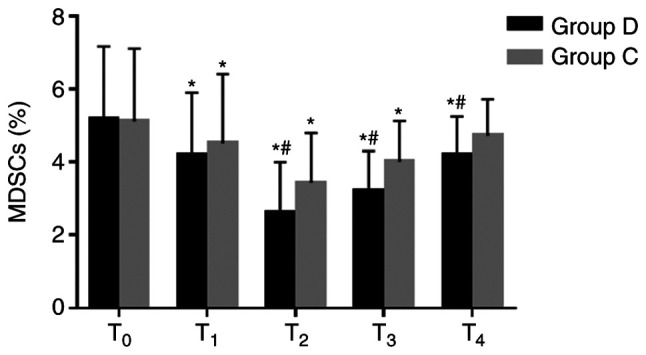
Figure 5.

Comparison of MDSCs at different time-points between the two groups. MDSCs were analyzed using flow cytometry. Percentages of MDSCs significantly decreased at T1-3 in the two groups compared with the baseline value at T0, and they were significantly lower at T2-4 in the dexmedetomidine group compared with the control group. *P<0.05 vs. T0, #P<0.05 vs. group C. MDSCs, myeloid-derived suppressor cells; D, dexmedetomidine; C, control; T0, 30 min before induction; T1, 1 h after induction; T2, end of the operation; T3, 24 h after operation; T4, 48 h after operation.
