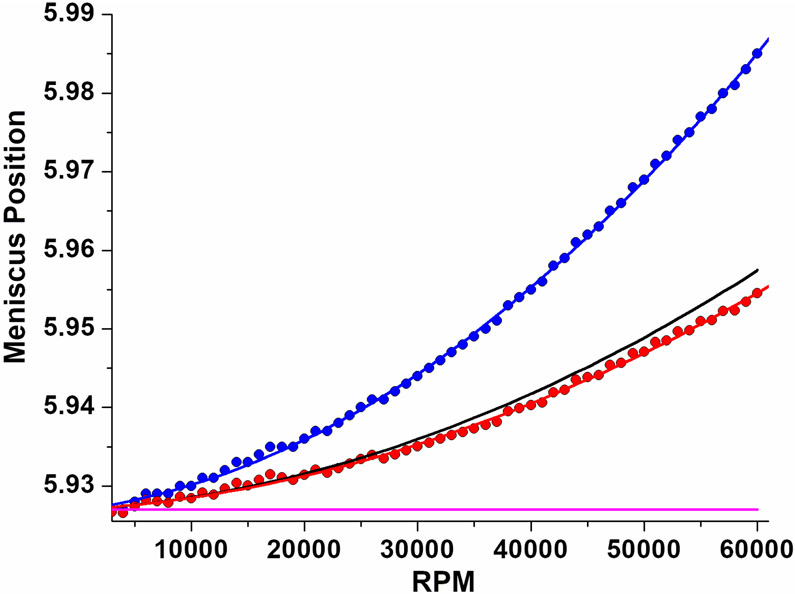
Figure 3:
Rotor stretch correction of compressibility data: All measurements (Toluene, blue) are convoluted with the rotor stretch (black line) which needs to be subtracted first to interpret the effect of compressibility to obtain a rotor stretch corrected dataset (red). For easier comparison, the rotor stretch function is offset by the meniscus position at zero RPM for this dataset (magenta line).

