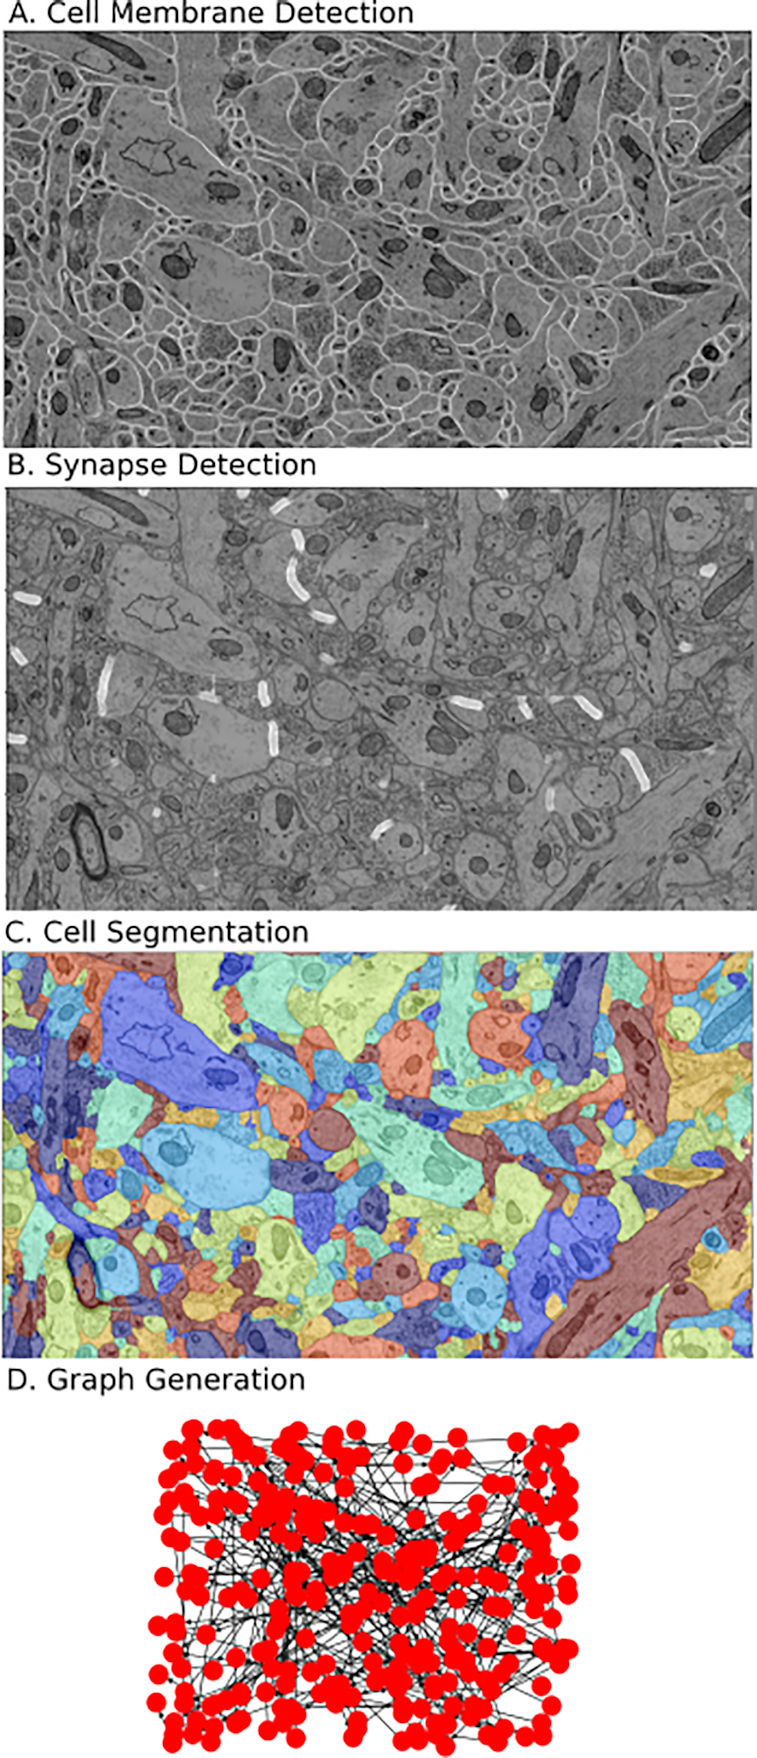
Figure 5:

Example deployment of EM segmentation pipeline to extract graphical models of connectivity from raw images. The processing pipeline (Fig. 1) consists of neural network tools to perform (A) membrane detection and (B) synapse detection. This is followed by a segmentation tool (C). Finally, segmentation and synapses are associated to create a graphical model. Visualizations of segmentations are done with Neuroglancer [44], a tool compatible with SABER and integrated with the bossDB [20] system.
