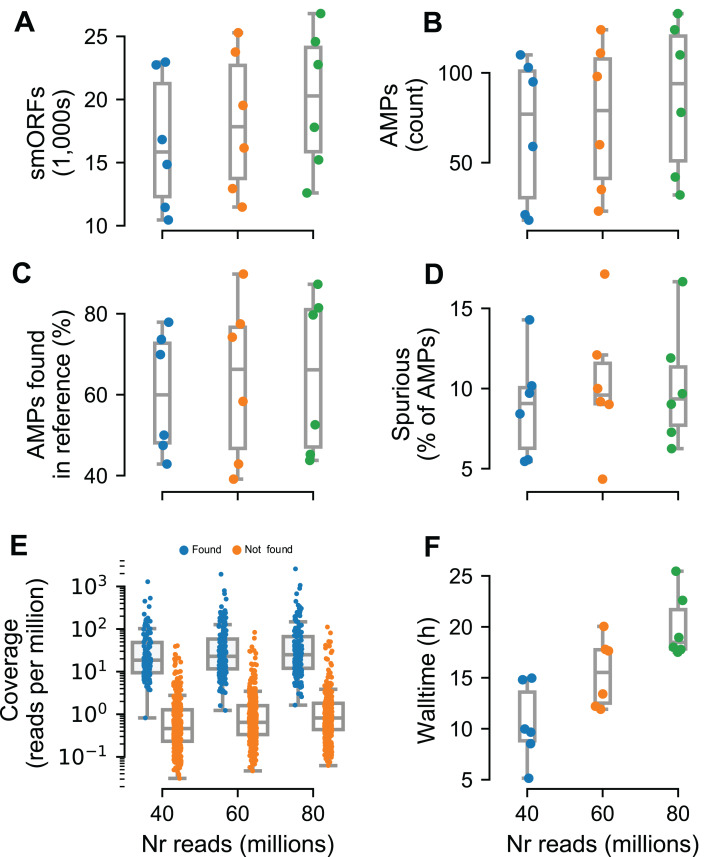
Figure 4. Macrel results in six different metagenome simulations involving variation of the number of reads (40–80 million).
Six different microbial communities with realistic species abundances were simulated with increasing sequencing depth (see “Methods”). Macrel recovers a large number of small ORFs (smORFs) per metagenome (A), and a small number of AMPs from each metagenome (B). The number of AMPs returned that were present in the reference genomes covers a large range (40–90%) (C), but only a small fraction is detected as being a spurious prediction (D) (see “Methods”). Detection of AMPs is heavily dependent on coverage (E), with almost all (97%) of the detected AMPs contained in genomes with coverage above 4.25 (this is the simulated coverage of the genome, which, due to the stochastic nature of the process, will only correspond to the local coverage, on average). Processing times increase with coverage, with the single largest sample taking 25.5 h (F). In all panels, boxplot whiskers represent 1.5 times the inter-quartile range (capped to the 0–100% range where appropriate).

