Figure 4.
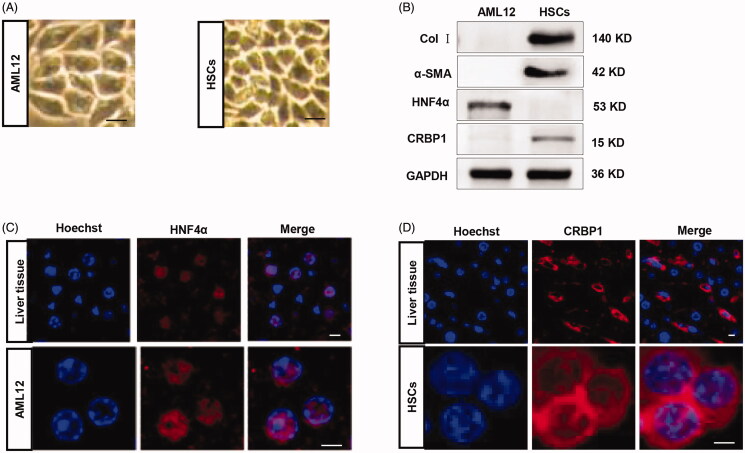
Validation and characterization of AML12 cells and HSCs. (A) Microscope image of the AML12 and HSC cells morphology; (B) western blot analysis of the expression of HNF4α/CRBP1 and α-SMA/collagen I in AML12 cells and HSCs. GAPDH served as the loading control. (C) immunofluorescence microscope image of the expression of HNF4α in the liver tissues and AML12 cells (scale bar = 5 μm). Nuclei were counterstained with Hoechst; (D) immunofluorescence microscope image of the expression of CRBP1 in the liver tissues and HSCs (scale bar = 2.5 μm). Nuclei were counterstained with Hoechst.

