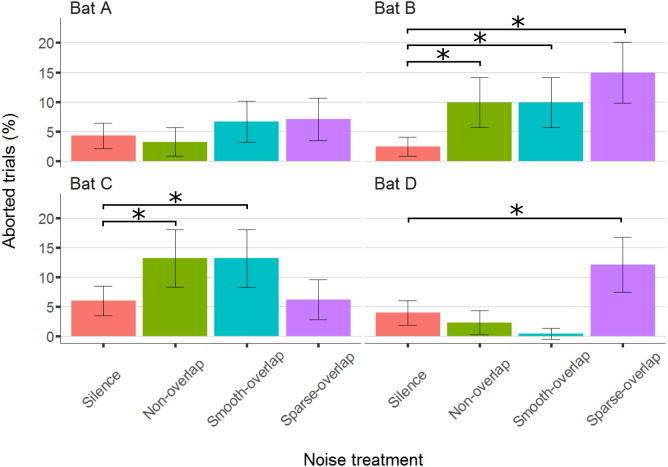
Figure 5. Percentage of aborted trials during the discrimination task by noise treatment.
Both bats B and C aborted significantly more trials for both non-overlapping and overlapping noise. Yet, bats B and D aborted significantly more trials for sparse-overlapping noise. Box plots show median (solid line) and first and third quartiles (edges of box); whiskers extend to the rest of the data minus outliers (more than 1.5 times the interquartile range), which are shown as points. Noise treatments have been abbreviated here (as compared to the text) to reduce visual clutter (smooth non-overlapping noise = “Non-overlap”; smooth-overlapping noise = “Smooth-overlap”; sparse-overlapping noise = “Sparse-overlap”). Asterisks denote significant differences (p < 0.05) in the percentage of aborted trials relative to the silence control.

