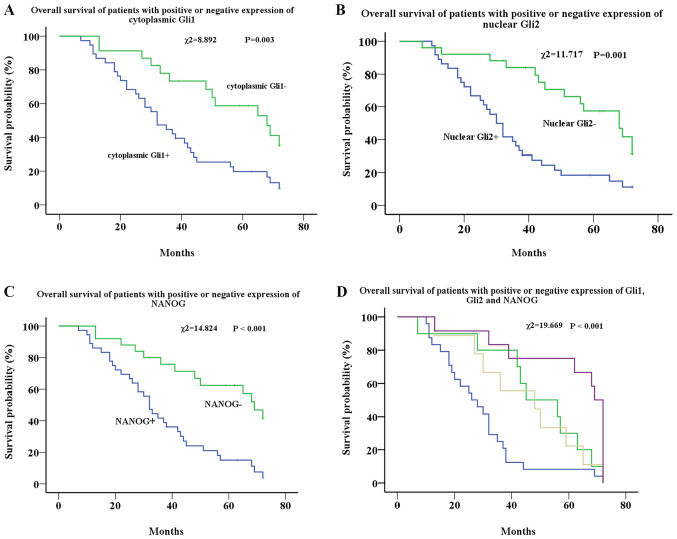
Figure 2.
Survival analysis of patients with EOC. (A) Survival analysis of patients with EOC with low (green line) and high (blue line) expression of cytoplasmic Gli1. (B) Survival analysis of patients with EOC with low (green line) and high (blue line) expression of nuclear Gli2. (C) Survival analysis of patients with EOC with low (green line) and high (blue line) expression of NANOG. (D) Survival analysis of patients with EOC with cytoplasmic Gli1+, nuclear Gli2+ and NANOG+ (blue line), cytoplasmic Gli1+, nuclear Gli2− and NANOG+ (yellow line), cytoplasmic Gli1−, nuclear Gli2+ and NANOG− (green line), and cytoplasmic Gli1−, nuclear Gli2− and NANOG− (purple line). EOC, epithelial ovarian cancer; NANOG, homeobox protein NANOG.

