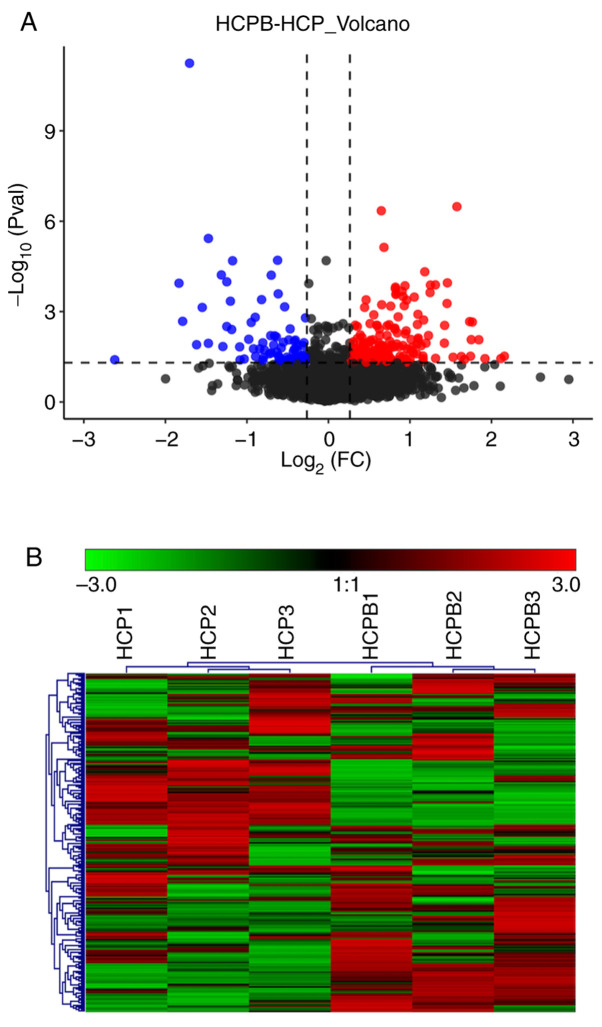
Figure 3.
Expression analysis of proteins identified through mass spectrometry. (A) Volcano plot showing the distribution of proteins that are upregulated (red) and downregulated (green) or showed no change (black) on overexpression of BMP2. (B) Hierarchical clustering of proteins vs. samples where rows represent the clustering of proteins, and columns represent the clustering of samples. As the protein abundance ratio changes from small to large, the heat map color shows a corresponding green-black-red change. BMP2, bone morphogenetic protein 2; HCP, human mesenchymal stem cells transfected with pCDNA 3.1; HCPB, human mesenchymal stem cells transfected with pCDNA 3.1-BMP2.

