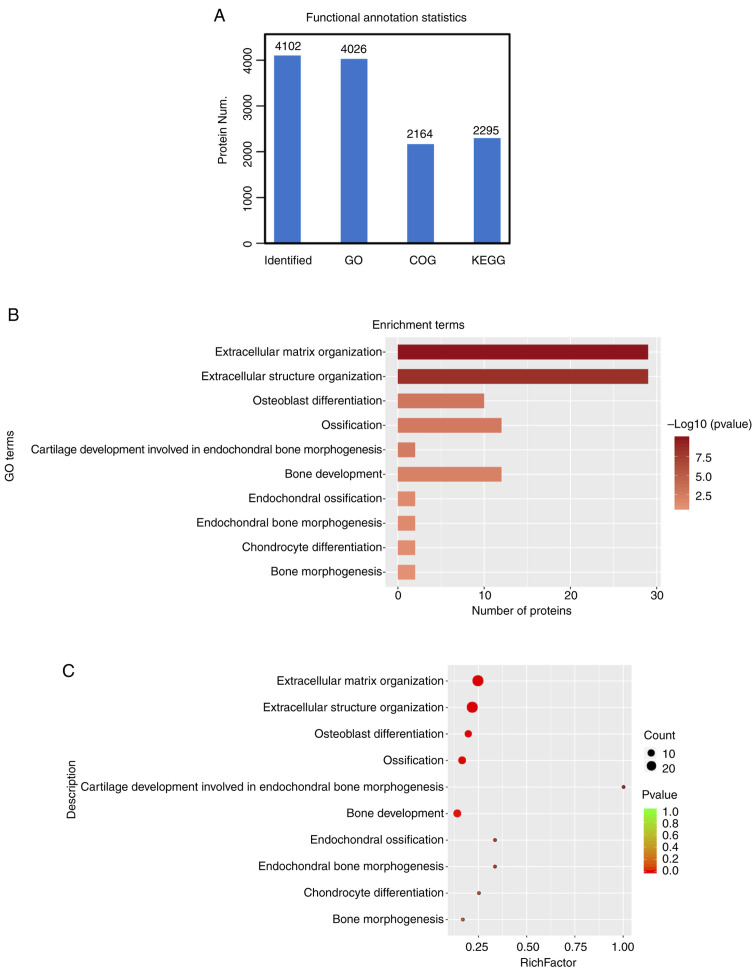
Figure 4.
Functional annotation analysis of differentially expressed proteins. (A) The number of proteins identified for each functional annotation is provided by the above bar graph with 4026 identified by GO of the total of 4102, 2164 by COG analysis and 2295 by KEGG pathway analysis. (B) The number of differentially expressed proteins plotted against functional annotation. (C) Bubble chart depicting the proteins significantly enriched for a particular functional pathway depicted by the enrichment factor (richfactor). More details can be found in Materials and methods. GO, Gene Ontology; COG, Clusters of Orthologous Groups of protein; KEGG, Kyoto Encyclopedia of Genes and Genomes.

