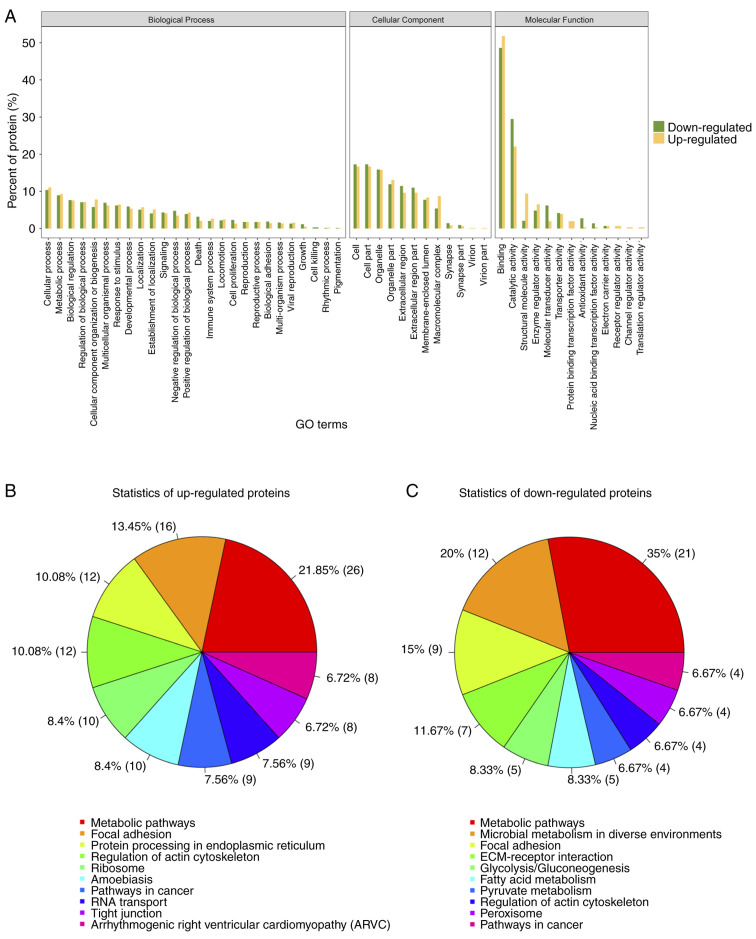
Figure 5.
Statistical protein histogram of differential protein GO function results. (A) The functional classification of the three categories of gene ontology. Yellow columns depicting the upregulated proteins, whereas green columns depict the downregulated proteins. (B) and (C) Comparison between HCPB: HCP for up- and downregulated proteins for different pathways. The number of proteins in each function is indicated in brackets. GO, Gene Ontology; HCP, human mesenchymal stem cells transfected with pCDNA 3.1; HCPB, human mesenchymal stem cells transfected with pCDNA 3.1-BMP2.

