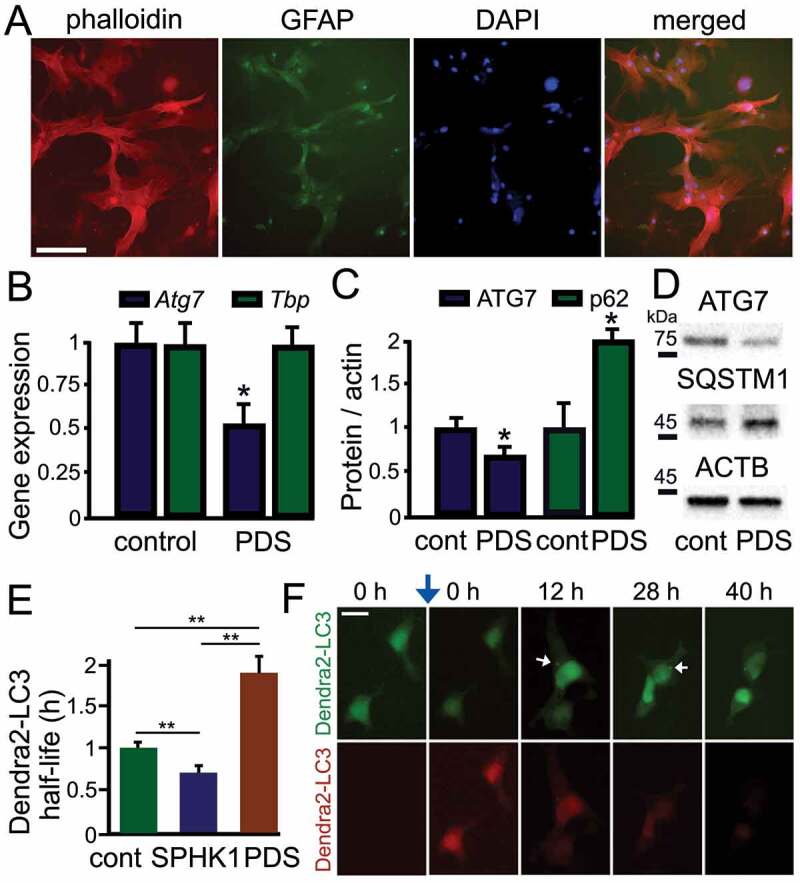
Figure 2.

PDS downregulates the ATG7 protein and the expression of Atg7 in astrocytes. (A) Primary astrocytes were cultured for 3 weeks from cortical tissue isolated from rat embryos. Cultures were fixed and stained with Alexa Fluor 633 phalloidin (red), DAPI (blue), and an antibody against GFAP (green). Most cells stained with phalloidin were positive for GFAP (94 ± 6%). Over 200 cells were analyzed, and results were pooled from three independent experiments. Scale bar: 40 µm. (B) Cultured primary astrocytes were treated with a vehicle (control) or with PDS (2 μM) overnight. Astrocytes were then processed to measure mRNA levels. Expression levels of Atg7 and Tbp (housekeeping gene as control) were determined by qRT-PCR. Atg7: p = 0.017 (t-test), *p < 0.05; Tbp: p = 0.7949 (t-test), n.s., non-significant. Results were pooled from six experiments. (C) Cultured primary astrocytes were treated with a vehicle (control) or with PDS (2 μM) overnight. Astrocytes were then processed to measure the levels of ATG7 and SQSTM1. ATG7: *p = 0.019 (t-test), SQSTM1: *p = 0.018 (t-test). Results were pooled from six experiments. (D) An example of western blotting experiments in (C). (E) Dendra2-LC3 was used to measure autophagy flux. Two cohorts of astrocytes were co-transfected with Dendra2-LC3 and an empty plasmid, or with Dendra2-LC3 and untagged SPHK1 (sphingosine kinase 1, a positive control). Astrocytes co-transfected with Dendra2-LC3 and an empty plasmid were treated with a vehicle (control, cont), or with 0.5 µM PDS overnight. After treatment, cells were photoswitched and longitudinally imaged, and the decay of the red fluorescence over time was used to calculate the half-life of Dendra2-LC3. The half-life of Dendra2-LC3 is normalized to one with respect to control astrocytes. cont vs SK1: *p = 0.001, cont vs PDS: **p = 0.001, SK1 vs PDS: **p = 0.001 (one-way ANOVA followed by Tukey’s multiple comparisons testing). Fifty cells per group were analyzed from two independent experiments. (F) An example of a photoswitching experiment with Dendra2-LC3 and SPHK1 (untagged). Astrocytes co-transfected with Dendra2-LC3 and SPHK1 were treated with a vehicle overnight. Cells were photoswitched and longitudinally imaged. Autophagosomes are depicted with white arrows. Blue arrow depicts photoswitching. Scale bar: 25 µm
