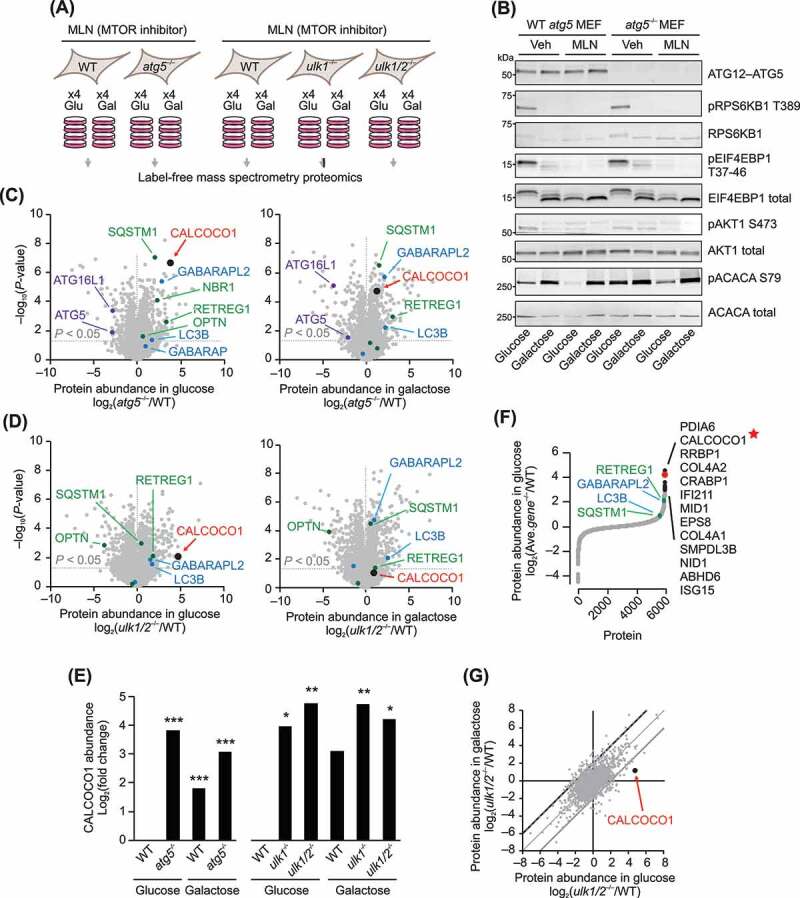
Figure 2.

Select autophagy receptors are elevated in atg–/– MEFs. (A) Summary of the mouse embryonic fibroblast (MEF) tissue culture conditions for the mass spectrometry proteomic profiling experiment. (B) Protein immunoblot analyses with the indicated antibodies of samples from the MEF cultures analyzed by mass spectrometry, plus a set a parallel MEFs cultured without MLN (Vehicle, Veh). (C) Relative protein abundances in atg5–/– MEFs compared to WT (mean, n = 4) cultured in media containing either glucose or galactose. Proteins were quantified by label-free mass spectrometry. P-values for the protein abundance changes were determined by a two-sided Student’s t-test. ATG5 and ATG16L1 proteins shown in purple font; Atg8 homologs are shown in blue; known selective autophagy receptors in green; CALCOCO1 in red. (D) Relative protein abundances in ulk1/2–/– MEFs compared to WT (mean, n = 4) cultured in media containing either glucose or galactose. (E) Relative abundance of mouse CALCOCO1 in atg5–/–, ulk1–/–, and ulk1/2–/– MEFs compared to WT in glucose and galactose media. P-values: * <0.05; ** <0.01; *** <0.001. (F) Average protein abundance changes in atg5–/–, ulk1–/–, and ulk1/2–/– MEFs compared to WT (mean, n = 4) in the glucose media condition. (G) Protein abundance changes in ulk1/2–/– MEFs compared to WT (mean, n = 4) in glucose media compared to galactose media
