
FIGURE 3. Cohort-level trends and outcomes.
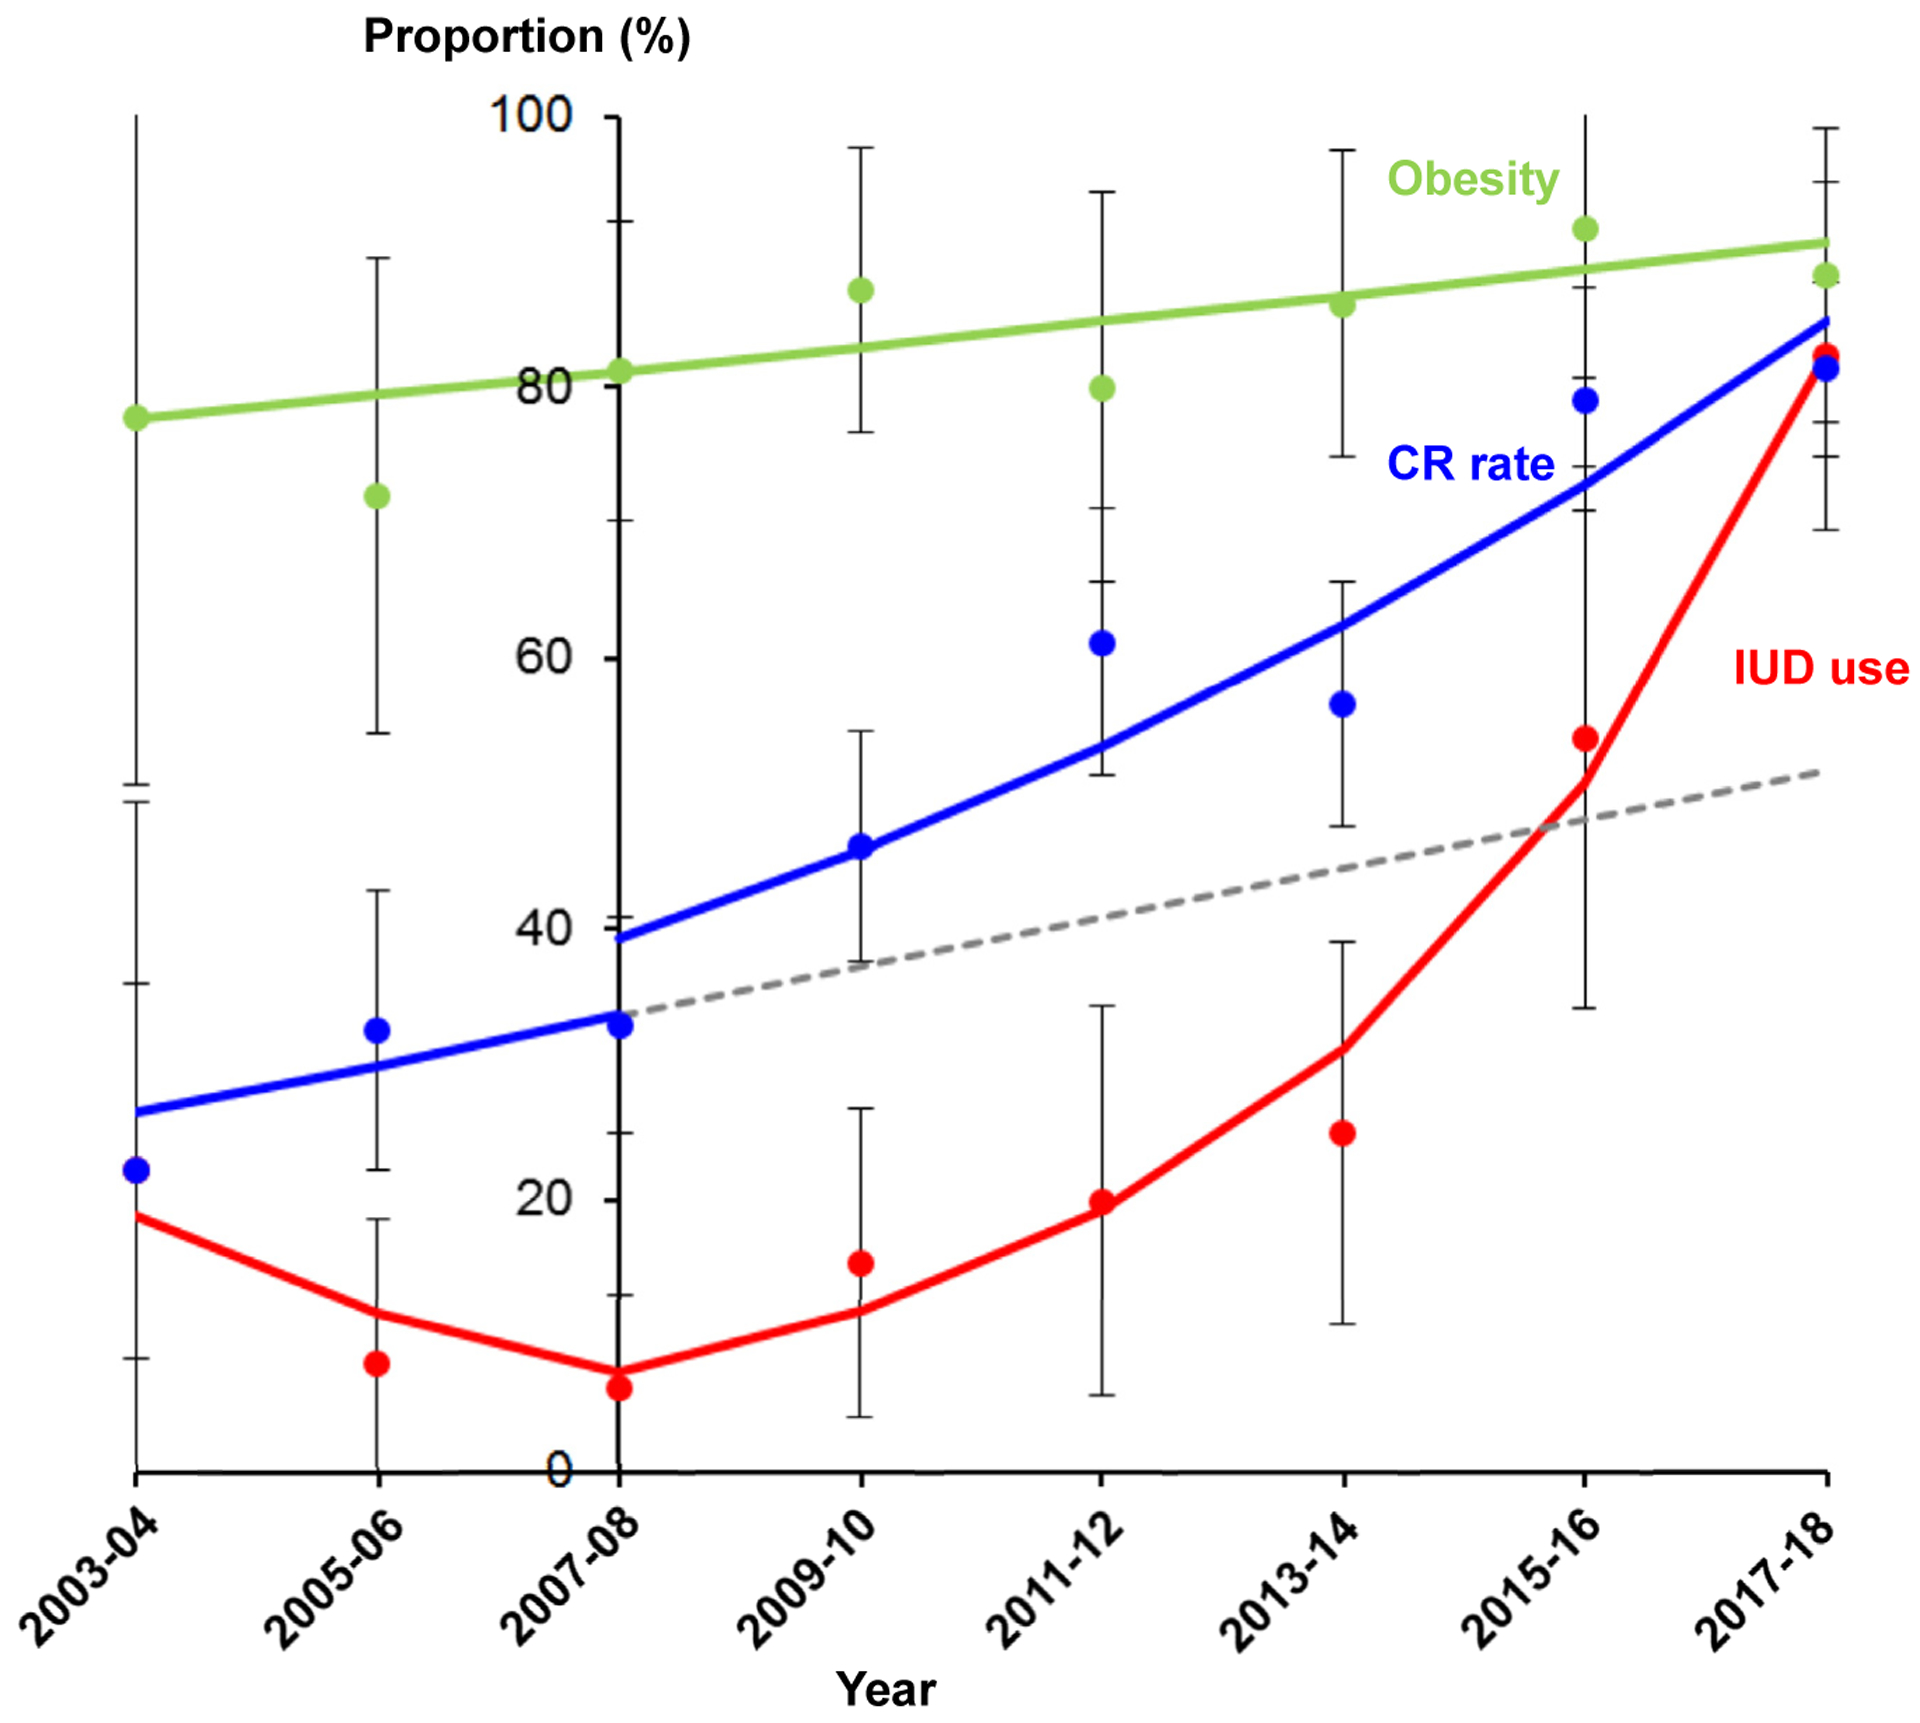
Temporal trends of levonorgestrel-releasing intrauterine device (IUD) use (red), complete response (CR) rate (blue), and obesity (green) are shown. Interrupted time-series analysis was performed for CR rate reflecting the change in IUD use over time, dividing the study period into before and after the 2007–2008 time point. The gray dashed line represents the modeled expected value for the CR rate before 2007–2008. After 2007–2008, IUD use significantly increased from 6.3% to 82.4% (13.2-fold increase; annual percent change [APC], 62.4; 95% confidence interval [CI], 41.9–85.9; P = .001). Before 2007–2008, the CR rate did not change significantly (22.2% to 32.9%, P = .480). After 2007–2008, the CR rate significantly increased from 32.9% to 81.4% (APC, 16.6; 95% CI, 8.1–25.8; P = .005). The obesity rate also significantly increased during the study (77.8% to 88.2%, 13.4% relative increase; APC, 2.2; 95% CI, 0.2–4.3; P = .033). Dots represent observed values with 95% CI or standard errors, and bold lines represent modeled values.