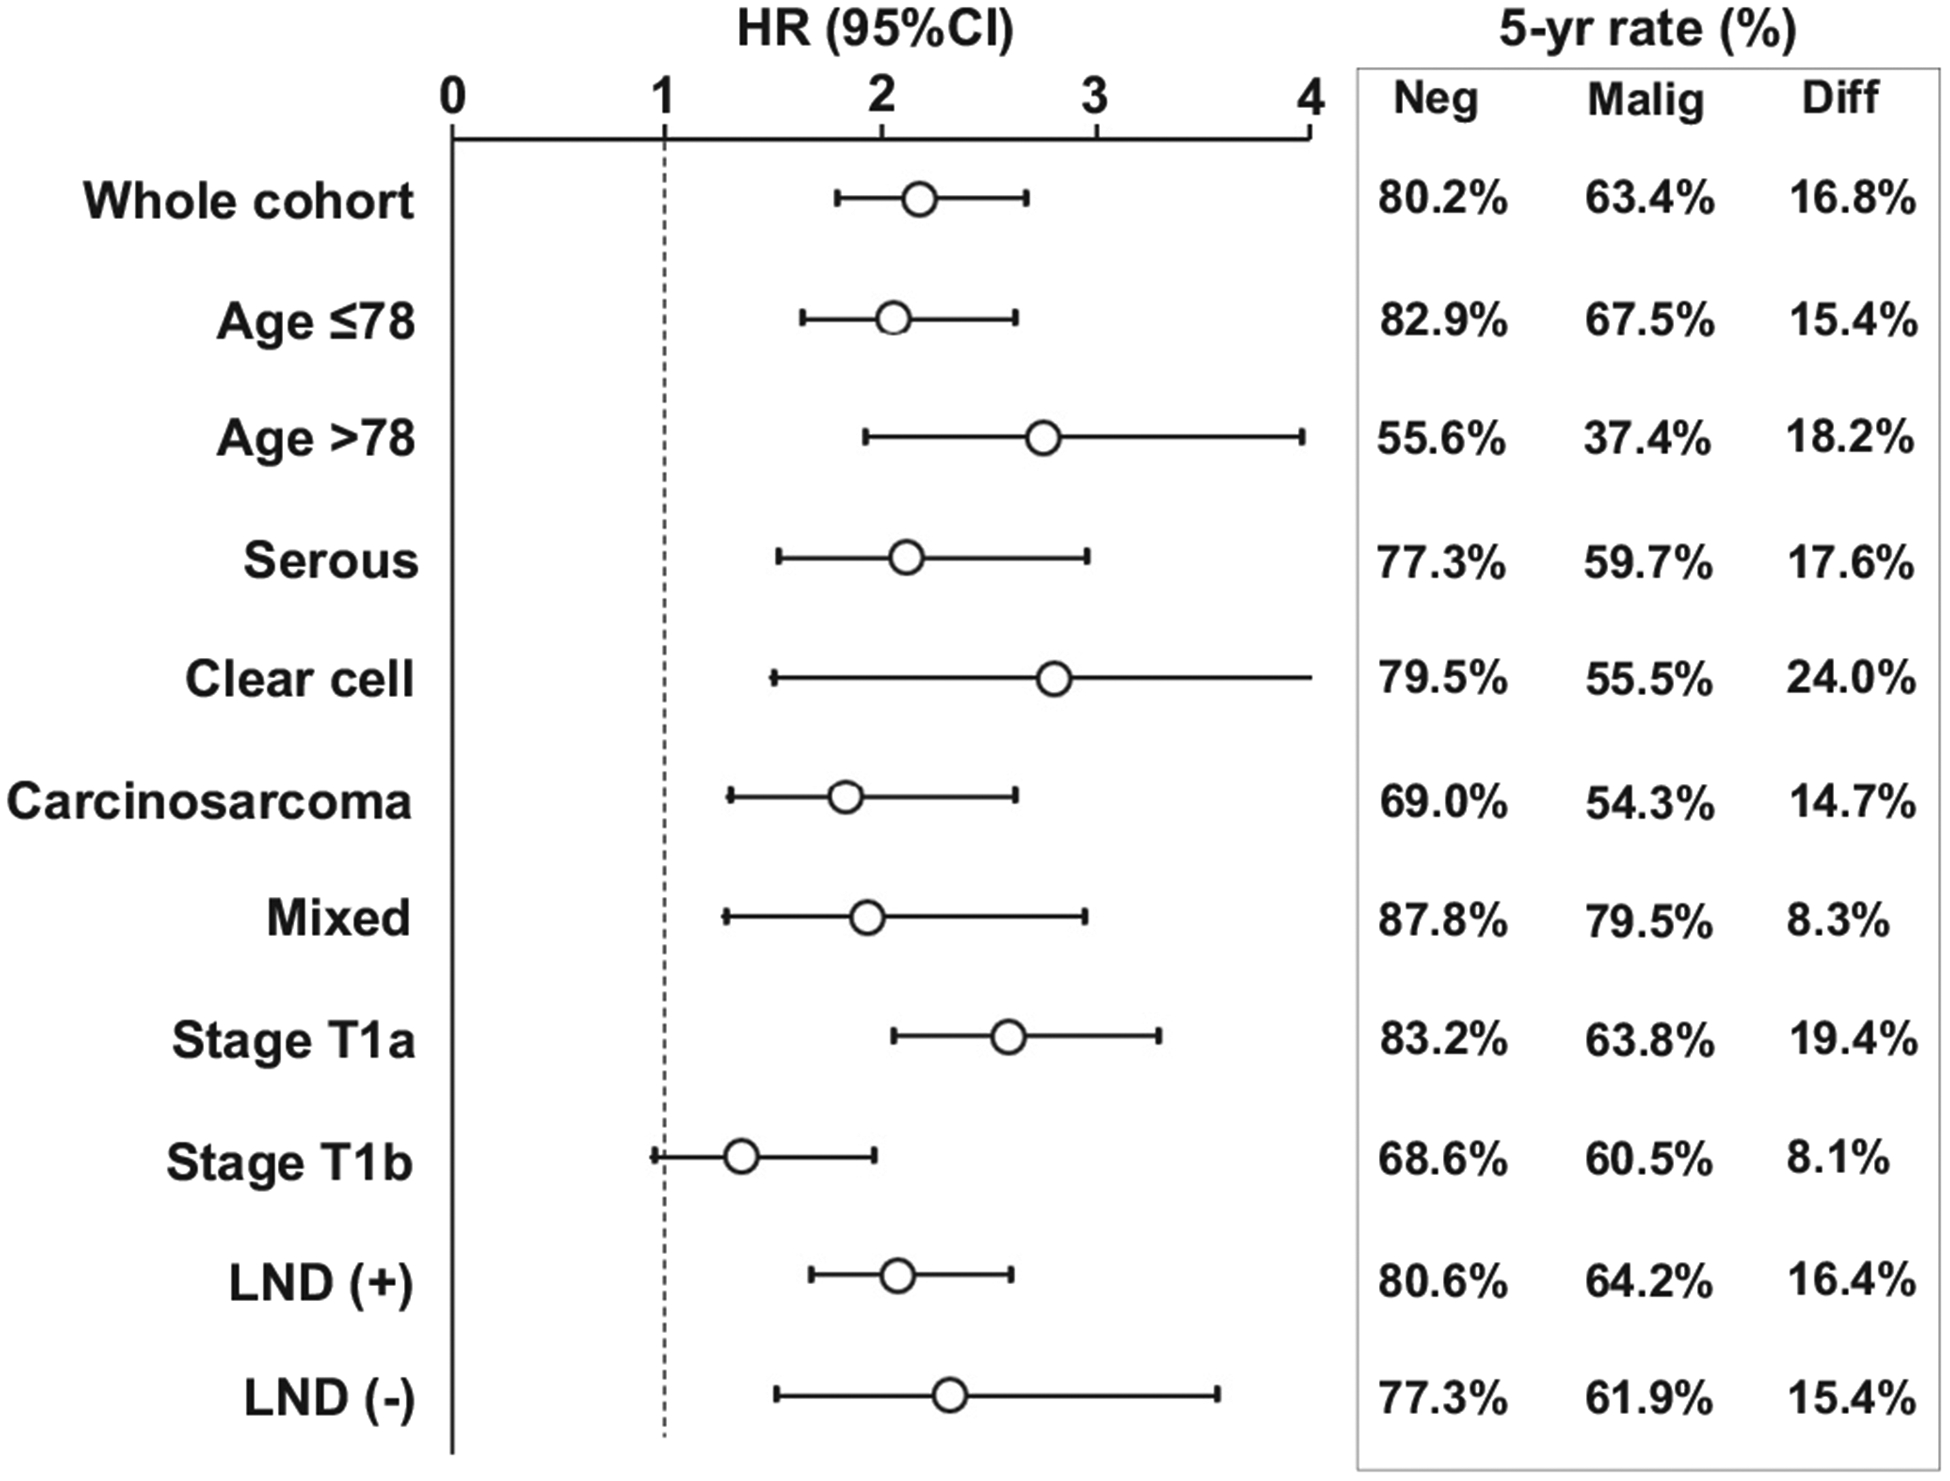
Fig. 3.

Forest plots for overall survival (weighted models). Association of peritoneal cytology (malignant versus negative) and overall survival was assessed with Cox proportional hazard regression in the weighted models. The 5-year survival rates and differences are shown. Circles represent HR, and bars represent 95%CI. Abbreviations: HR, hazard ratio; CI, confidence interval; LND, lymphadenectomy; Neg, negative peritoneal cytology; Malig, malignant peritoneal cytology; and Diff, difference in 5-year survival rate between the negative and malignant cytology groups.
