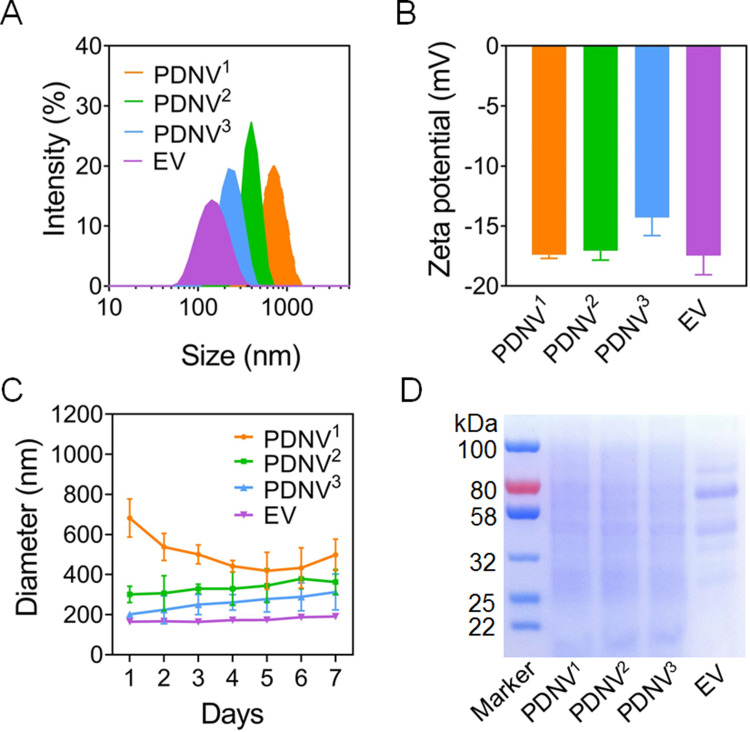
Figure 2.
Characterization of PDNVs with different sizes. (A–B) Hydrodynamic size (diameter, nm) and zeta potential of PDNVs. S. aureus-derived EVs were used as positive control. (C) Size changes of PDNVs in PBS buffer. (D) SDS-PAGE analysis of PDNVs. The molecular weights of a protein marker are shown on the left. Data are presented as means ± SD (n = 3).

