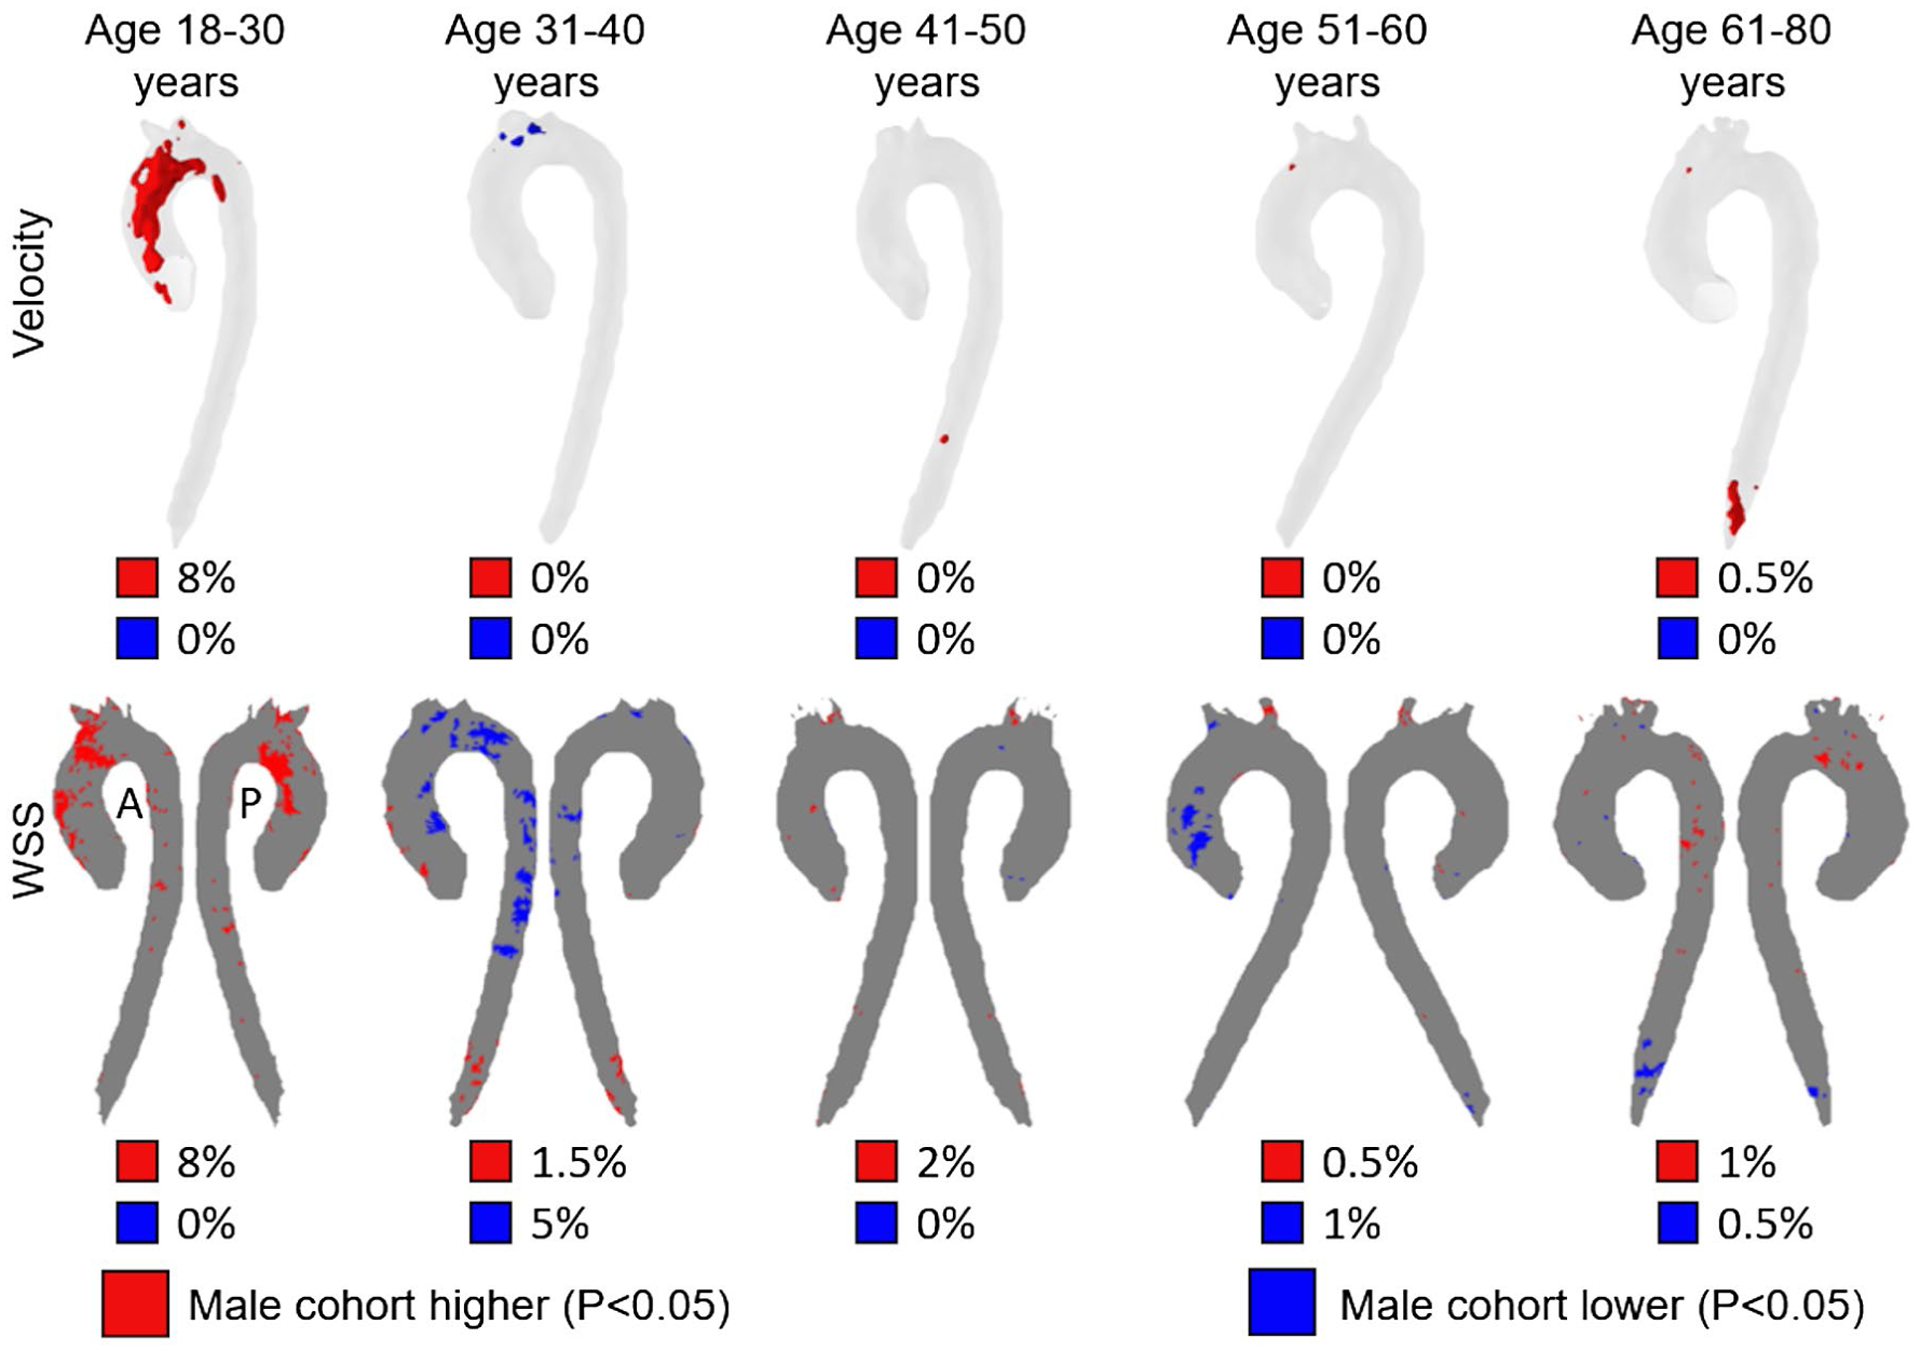
FIGURE 2.

Top row: Voxel-wise P-value maps showing voxels where velocity was significantly different (P < .05) between male and female cohorts of the same age. The percentiles below each P-value map indicate the fraction of the aorta volume where the male cohort has decreased (blue) or increased (red) velocities compared with the female cohort. Bottom row: P-value maps for 3D-WSS, showing points on the surface of the aorta where the 3D-WSS was significantly different between male and female cohorts of the same age (P < .05). The percentiles below each P-value map indicate the fraction of the aorta surface area where the male cohort has decreased (blue) or increased (red) 3D-WSS compared with the female cohort
