
FIGURE 3.
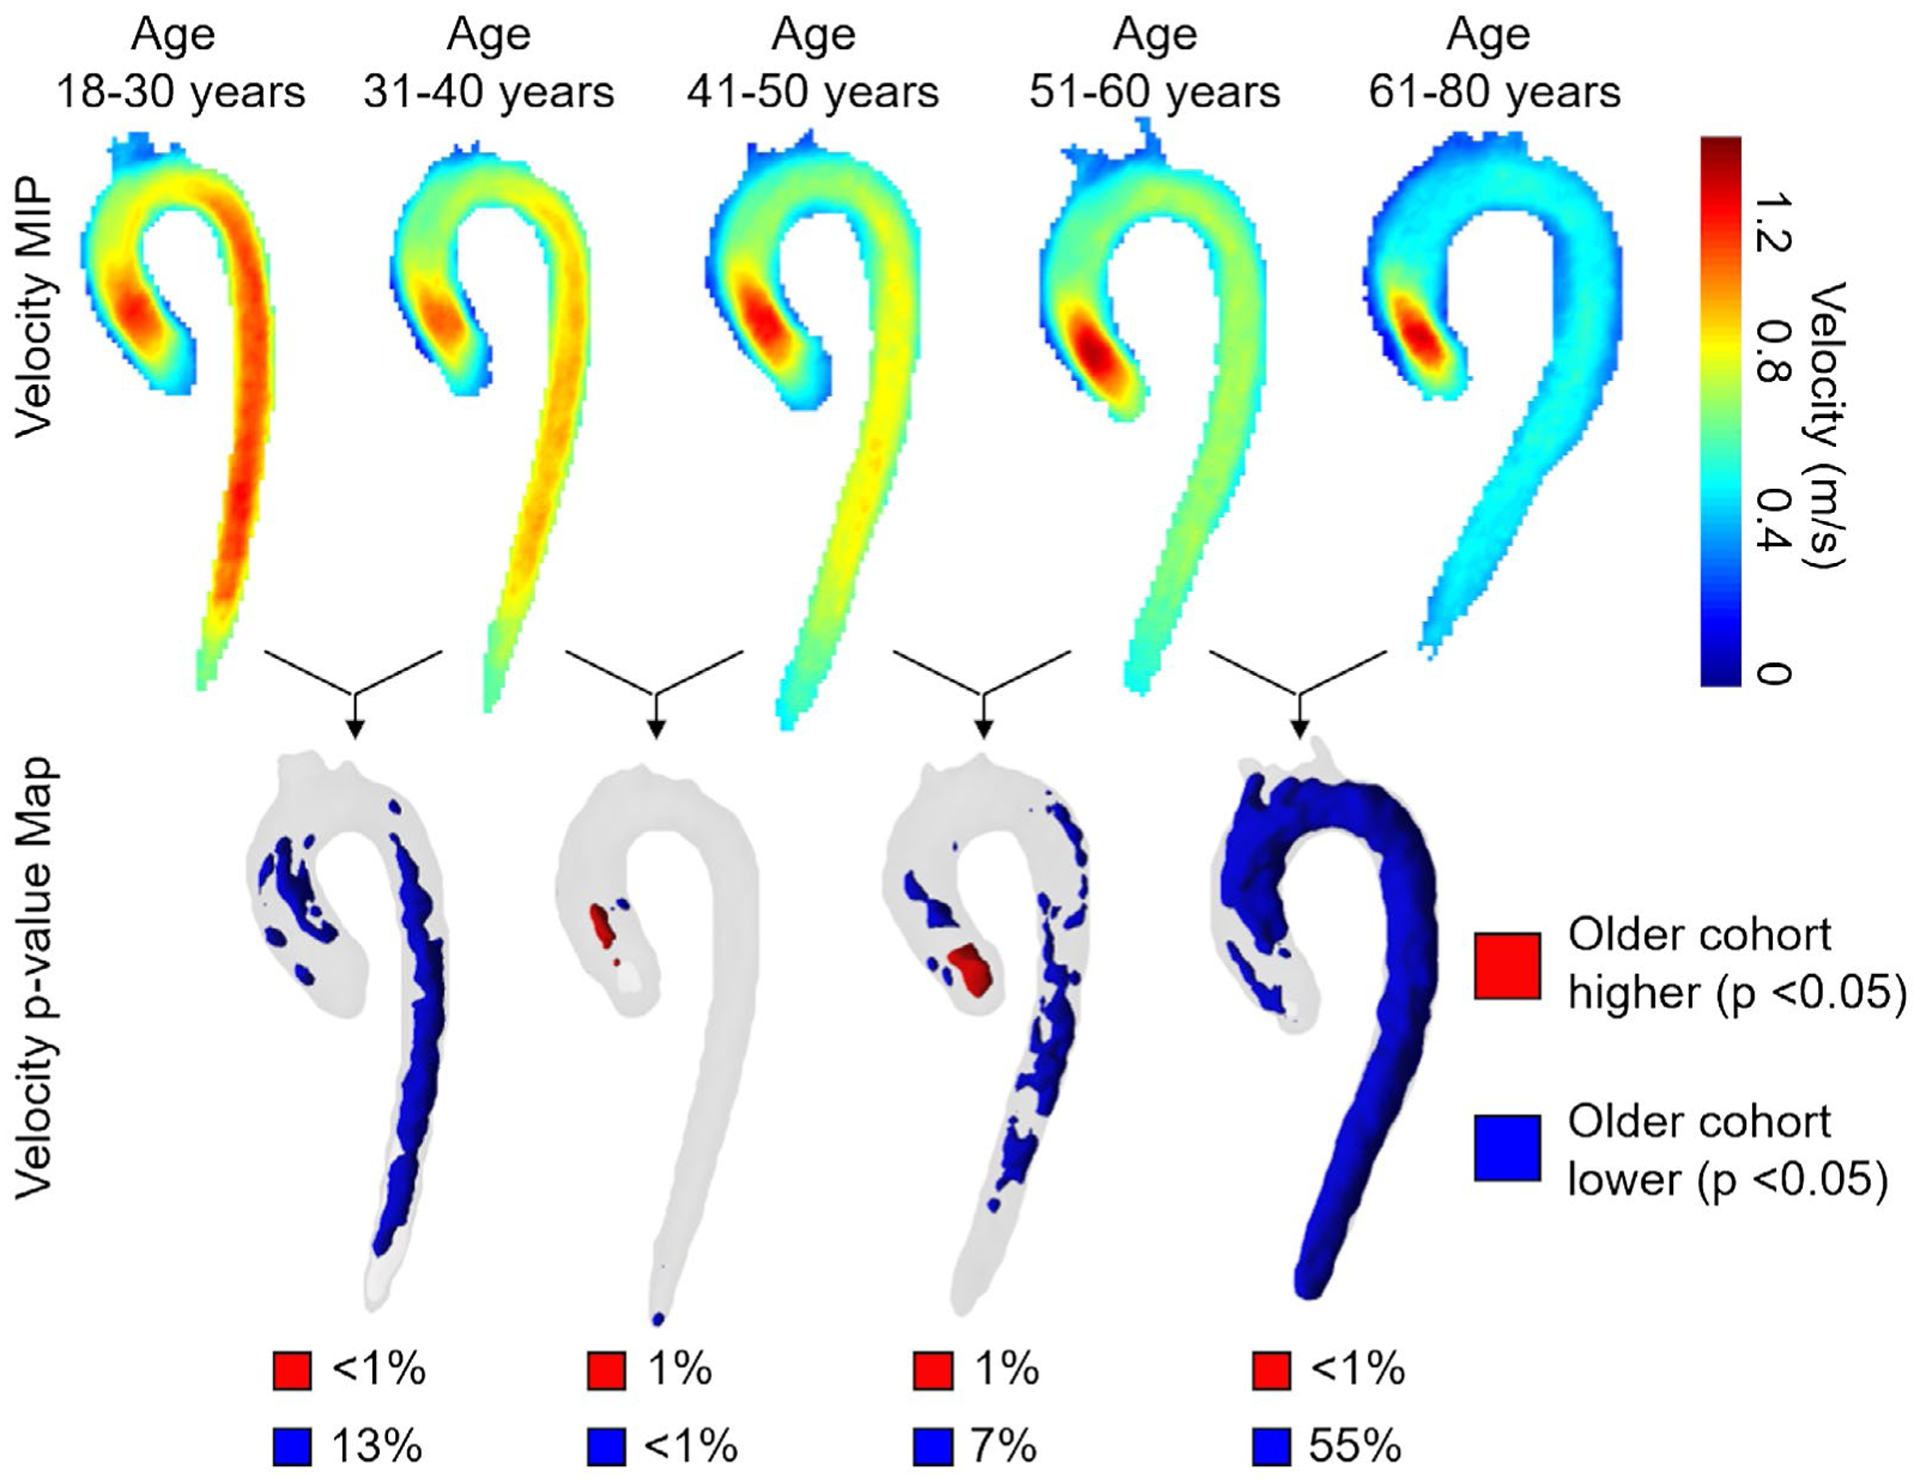
Top row: Side-by-side comparisons of systolic velocity atlases (velocity MIPs) for each cohort of 20 age-stratified controls (10 males + 10 females in each group). For each age group, the atlas geometry was determined independently by registration of the 20 aortas. An age-dependent reduction of aorta systolic velocities can clearly be appreciated. Bottom row: Voxel-wise P-value maps calculated by pairwise registering the older to the younger cohort. Regions in blue/red show aorta regions with significantly lower/higher velocity (P < .05). The percentiles below each P-value map indicate the fraction of the aorta volume with decreased (blue) or increased (red) velocities compared with the younger cohort