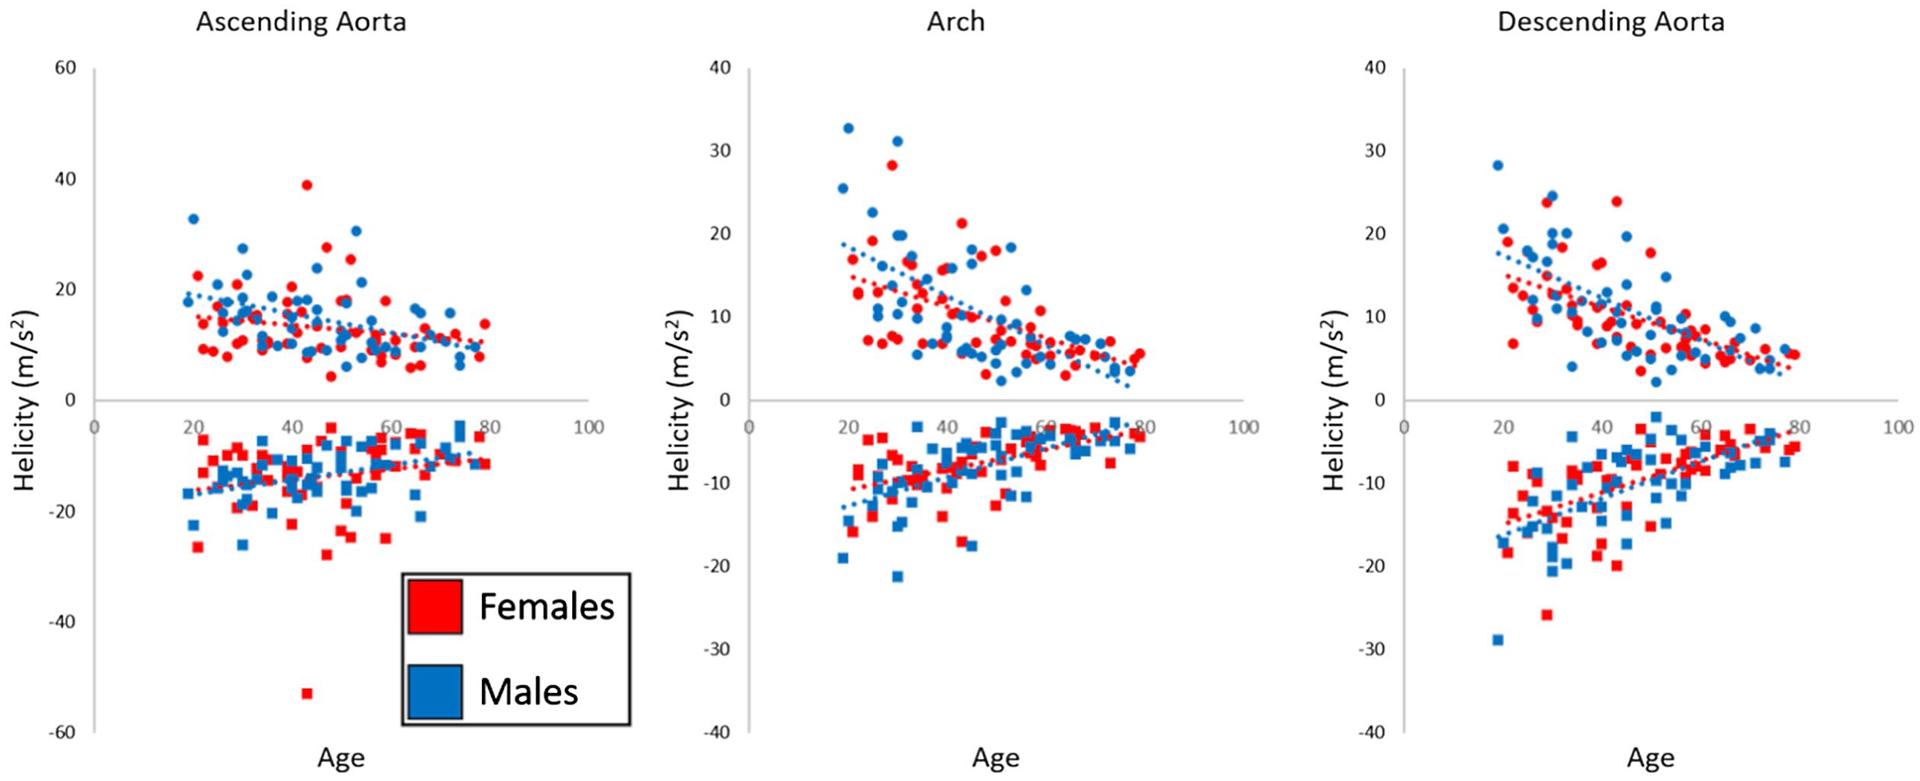
FIGURE 5.

Regional systolic helicity in all N = 100 healthy controls. Red markers indicate females, whereas blue markers indicate males, with circles showing the median positive helicity in the region and squares showing the median negative helicity in the region for each subject. Dashed lines indicating a linear fit show decreasing systolic helicity magnitude with age for both sexes
