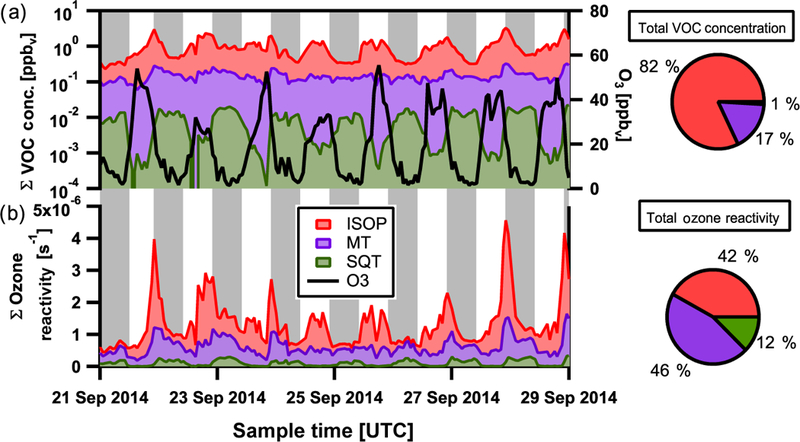
Figure 5.

Dry season selected timeline of summed gas-phase VOC concentrations, isoprene (ISOP, red), monoterpenes (MT, purple), and estimated sesquiterpenes (SQTs, green) and ozone concentration (O3, black) in panel (a). Average percentage contributions during the dryseason for each group to total VOC concentration are also shown in the top pie chart. Panel (b) depicts the summed contribution to ozonereactivity from isoprene, monoterpenes, and sesquiterpenes. Average percentage contributions during the dry season for each VOC to totalozone reactivity are shown in the bottom pie chart. Local nighttime hours indicated in grey. Local time is −4 h relative to UTC.
