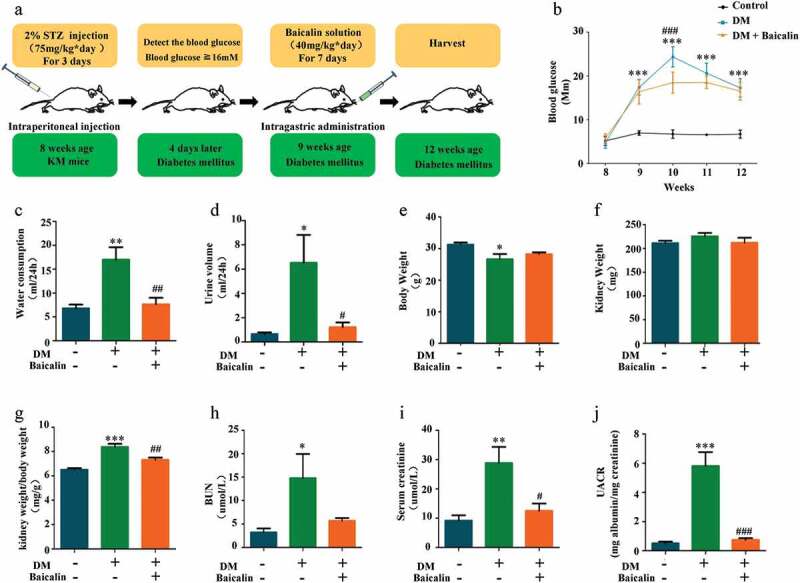
Figure 1.

Mouse blood glucose levels and renal functions after STZ administration in the absence/presence of baicalin
a: Illustration showing the production of the STZ-induced diabetic mouse model. In addition, timing for blood glucose measurements and baicalin administration. b: Graph showing blood glucose levels at week 8–12 following STZ administration amongst controls, DM and DM + Baicalin treatment groups. c-j: Bar charts comparing water consumption at 24 hours (c), urine volume at 24 hours (d), body weight (e), kidney weight (f), ratios of kidney and body weights (g), BUN in blood (H), serum creatinine in blood (I), and UACR (j) amongst control, DM and DM + Baicalin groups. Abbreviation: STZ, streptozotocin; BUN, blood urea nitrogen; UACR, urine albumin-to-creatinine ratio. *p < 0.05, **p < 0.01, ***p < 0.001 compared with control group; #p < 0.05, ##p < 0.01, ###p < 0.001 compared with DM group.
