
Figure 4.
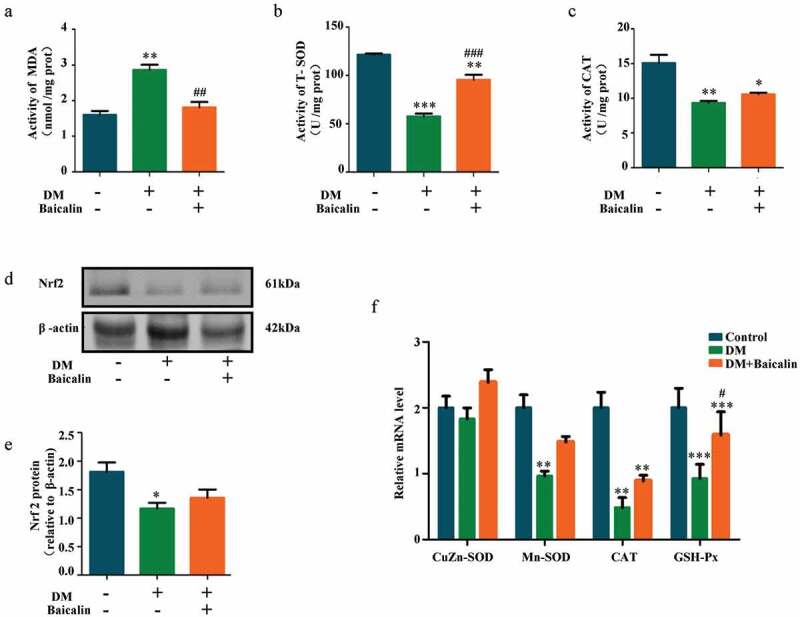
Assessments of oxidative stress in renal tissues of diabetic mice with baicalin treatment
a-c: Bar charts showing MDA (A), SOD (B) and CAT (C) activities in control, DM and DM + Baicalin kidney tissues. d-e: Western blot showing extent of Nrf2 expressions in control, DM and DM + Baicalin treated kidney tissues. f: RT-qPCR showing the extent of CuZn-SOD, Mn-SOD, CAT and GPX expressions. *p < 0.05, **p < 0.01, ***p < 0.001 compared with control group; #p < 0.05, ##p < 0.01, ###p < 0.001 compared with DM group.