
Figure 7.
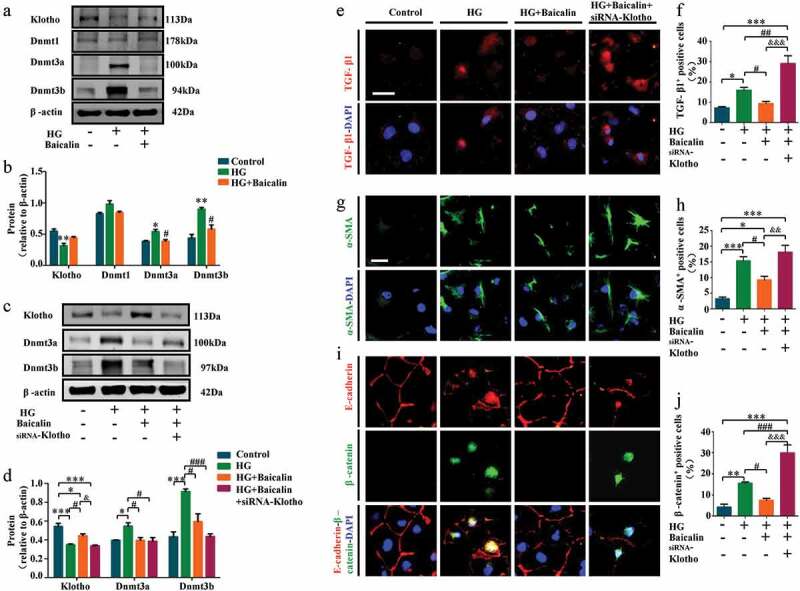
Klotho, DNMT and profibrotic-associated proteins expressions after silencing Klotho in HK2 cells treated with high glucose and baicalin
a-b: Western blots showing extent of Klotho, Dnmt1, Dnmt3a, and Dnmt3b expressions in HK2 cells. c-d: Effects of silencing Klotho on Dnmt3a and Dnmt3b expressions. e: Representative micrographs of HK2 cells immunofluorescently stained for TGF-β1. f: Bar chart showing the percentage comparisons of TGF-β1+ HK2 cells. g: Representative micrographs of HK2 cells immunofluorescently stained for ɑ-SMA. h: Bar chart showing the percentage comparisons of ɑ-SMA+ HK2 cells. i: Representative micrographs of HK2 cells immunofluorescently stained for E-cadherin, β-catenin, E-cadherin and β-catenin expression in control, HG, HG + Baicalin, and HG + Baicalin + siRNA-Klotho groups. j: Bar charts showing percentage of β-catenin+ HK2 cells. Scale bars = 20 µm in E, G and I. *p < 0.05, **p < 0.01, ***p < 0.001 compared with control group; #p < 0.05, ##p < 0.01, ###p < 0.001 compared with HG group; &p < 0.05, &&p < 0.01, &&&p < 0.001 compared with HG + Baicalin group.