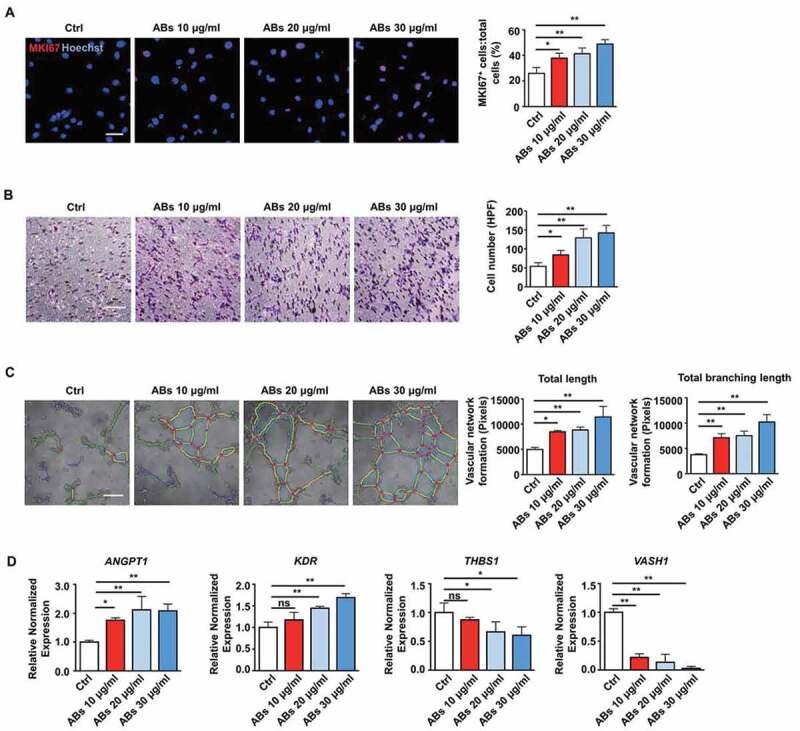
Figure 3.

ABs activated the angiogenic capacities of ECs in vitro. (A) Proliferation was detected by MKI67 staining and quantified by the positive-stained percentage. Scale bar: 50 µm. (B) Cell migration was assessed by trans-well assay and quantified by the cell numbers. Scale bar: 20 µm. HPF, high power field. (C) Tube formation capacity on the Matrigel. The images were analyzed by ImageJ software. Scale bar: 20 µm. (D) HUVECs were incubated with ABs at concentrations of 10, 20 or 30 µg/ml for 12 h. The mRNA expression levels of ANGPT1, KDR, THBS1 and VASH1 were evaluated by qPCR. The results were representative of the data generated in at least 3 independent experiments. The data were presented as mean ± SEM. ns, not significant; *P < 0.05; **P < 0.01 by one-way ANOVA (A, B, C, D)
