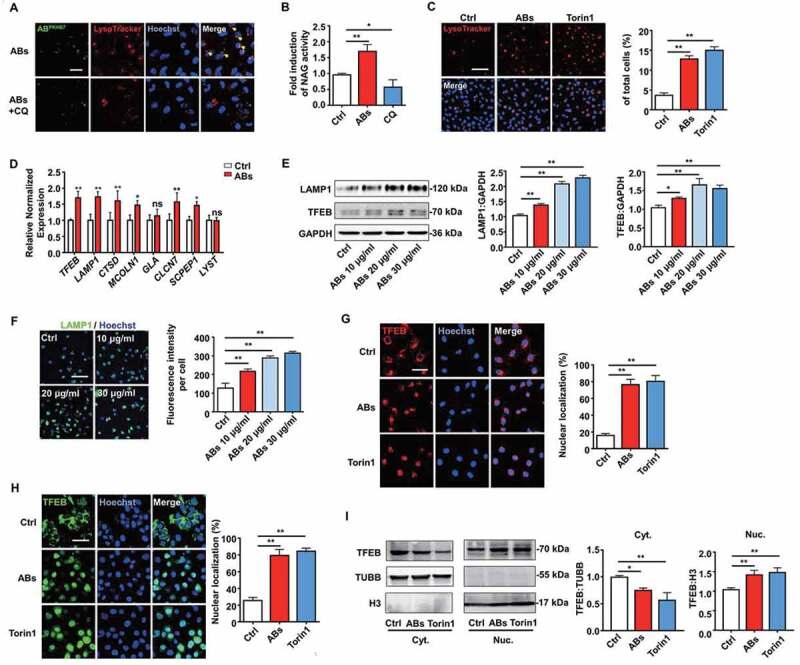
Figure 4.

ABs activated TFEB-dependent lysosome biogenesis of ECs. (A) PKH67-labeled ABs co-localized with lysosomes, which were stained with LysoTracker Red in HUVECs. CQ-treated HUVECs were used as a negative control. Scale bar: 25 µm. Chloroquine, CQ. (B) Relative lysosomal NAG activity of AB-treated and CQ-treated HUVECs. (C) HUVECs were treated with ABs (10 µg/ml, 12 h) or torin1 (1 µM, 3 h; as positive control) and stained with LysoTracker Red. The percentage of LysoTracker Red staining was quantified. Scale bar: 100 µm. (D) qPCR analysis of lysosomal genes. (E) LAMP1 and TFEB expression detected by western blots in HUVECs treated with ABs. (F) The expression of LAMP1 was detected by immunofluorescence staining, and the fluorescence intensity was quantified by ImageJ software. Scale bar: 100 μm. (G) Immunofluorescence of the subcellular locations of endogenous TFEB in HUVECs treated with ABs or torin1. The percentage of TFEB nuclear translocation was quantified. Scale bar: 50 µm. (H) HUVECs were infected with adenoviral vectors TFEB-EGFP. Forty-eight hours later, the cells were treated with ABs (20 µg/ml, 12 h) or torin1 (1 µM, 3 h). The subcellular location of TFEB was determined by green fluorescence. The percentage of TFEB nuclear translocation was quantified. Scale bar: 50 µm. (I) The expression of endogenous TFEB in the cytosolic (Cyt.) and nuclear (Nuc.) fractions was detected by western blots after treated with ABs or torin1. TUBB (tubulin, beta) and H3 were used as loading controls of the cytoplasmic and nuclear fraction, respectively. Quantitative analysis of the western blots in this study was performed by ImageJ software. The results were representative of data generated in at least 3 independent experiments. The data were presented as mean ± SEM. ns, not significant; *P < 0.05; **P < 0.01 by Student’s t-test (D) or one-way ANOVA (B, C, E, F, G, H, I)
