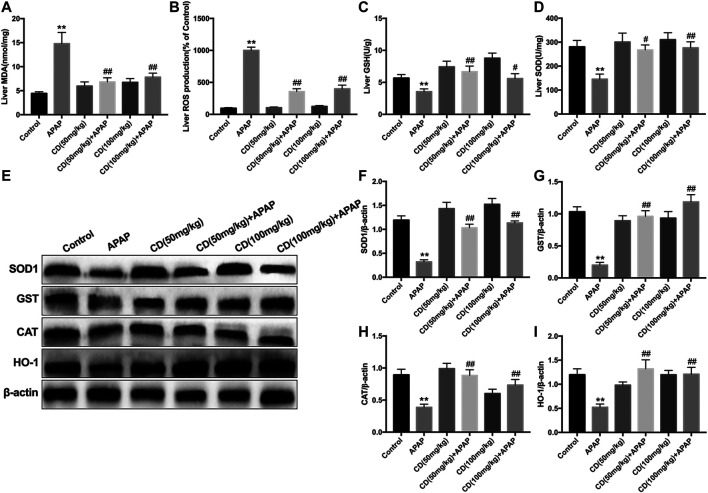
FIGURE 4.
Effects of CD treatment on levels of oxidative markers in APAP-induced ALI. Liver tissue was collected 6 h after APAP injection for assessment of ROS, MDA, SOD, and GSH. (A–D) Effect of CD on concentrations of ROS, MDA, SOD, and GSH. (E–I) Protein abundance of HMOX1, SOD1, CAT, and GST. β-Actin was used as an internal control. Similar results were obtained from three independent experiments. All data are presented as means ± SEM (n = 10 in each group). *p < 0.05 and **p < 0.01 vs. control group; # p < 0.05 and ## p < 0.01 vs. APAP group.

