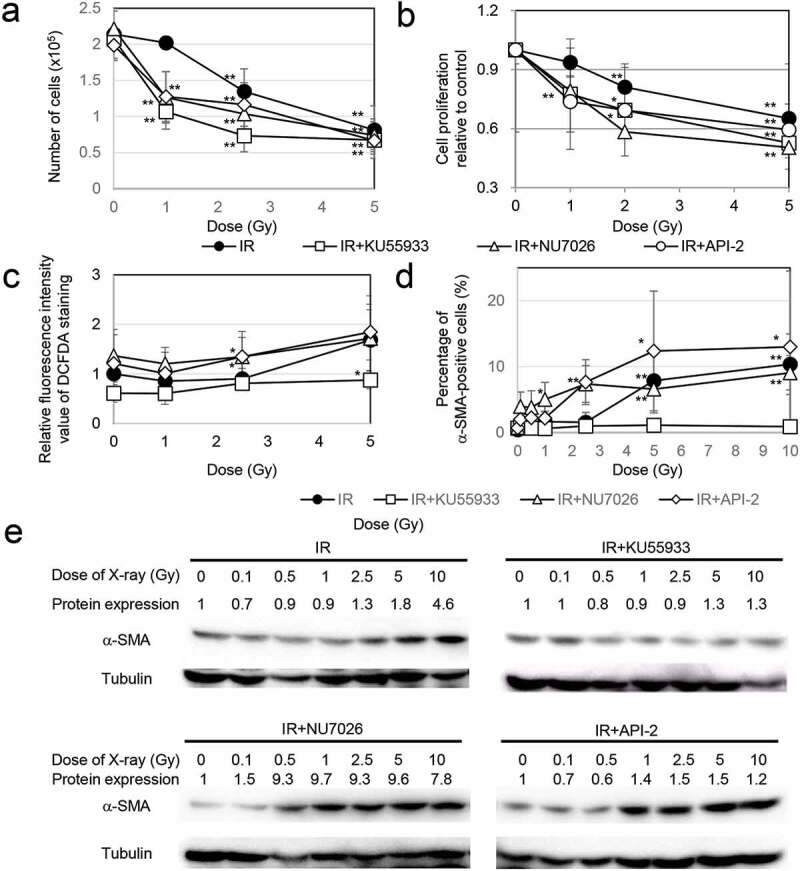
Figure 2.

Association of DDR with myofibroblast induction
(A) Effects of inhibitors on cell growth after irradiation. The asterisk indicates a significant decrease in the number of cells compared with nonirradiated control cells. (B) Viability of TIG-3 cells as evaluated by MTT assay. The cell viability of the treatment group was normalized to the value of the nonirradiated group and is shown as the mean value ± SD. The asterisk indicates a significant decrease in cell proliferation rate compared with nonirradiated control cells. (C) The relative fluorescence intensity values of DCFDA staining were normalized to that of the nonirradiated controls. The asterisk indicates a significant increase in fluorescence intensity value of DCFDA staining compared with nonirradiated control cells. (D) The percentage of α-SMA-positive TIG-3 cells in each treatment group is shown in the graph on the right. The asterisk indicates a significant increase in the percentage of α-SMA-positive cells compared with nonirradiated control cells. (E) Western blotting for α-SMA among the indicated treatment groups. The amounts of α-SMA were normalized by the corresponding tubulin level. The values are expressed relative to the untreated control value.
