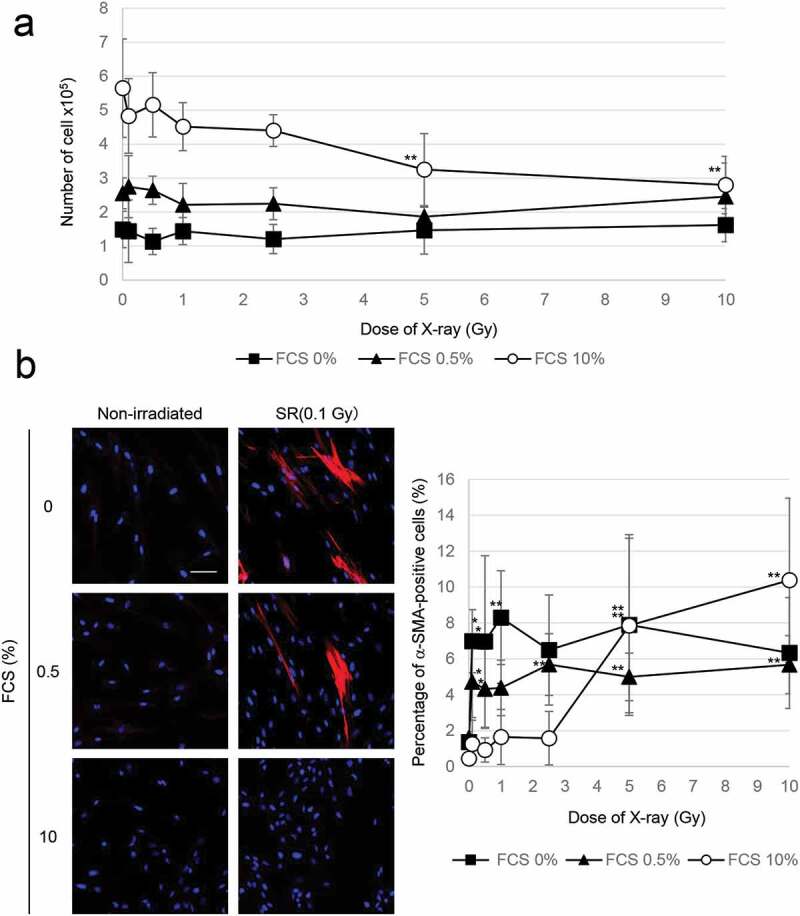
Figure 3.

Growth inhibition enhanced myofibroblast induction
(A) Cell growth after irradiation at the indicated doses under different culture conditions. The asterisk indicates a significant decrease in the number of cells compared with nonirradiated control cells. (B) Images of α-SMA staining in the indicated cells. Scale bar = 50 µm. The percentage of α-SMA-positive TIG-3 cells in different culture conditions is shown in the graph on the right. The asterisk indicates a significant increase in the percentage of α-SMA-positive cells compared with nonirradiated control cells.
