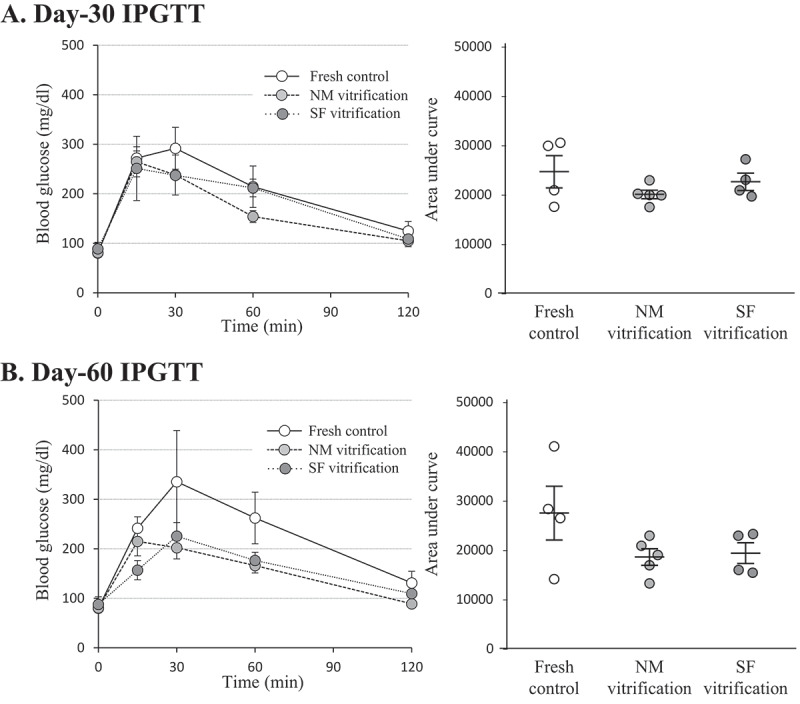
Figure 4.

IPGTT and corresponding AUC of cured recipient rats. (A) Day-30. (B) Day-60. Mean ± SE of 4 or 5 individuals in each group. Individual AUC data were plotted on the Mean ± SE and compared by Tukey’s Honest Significant Difference test for multiple comparisons
