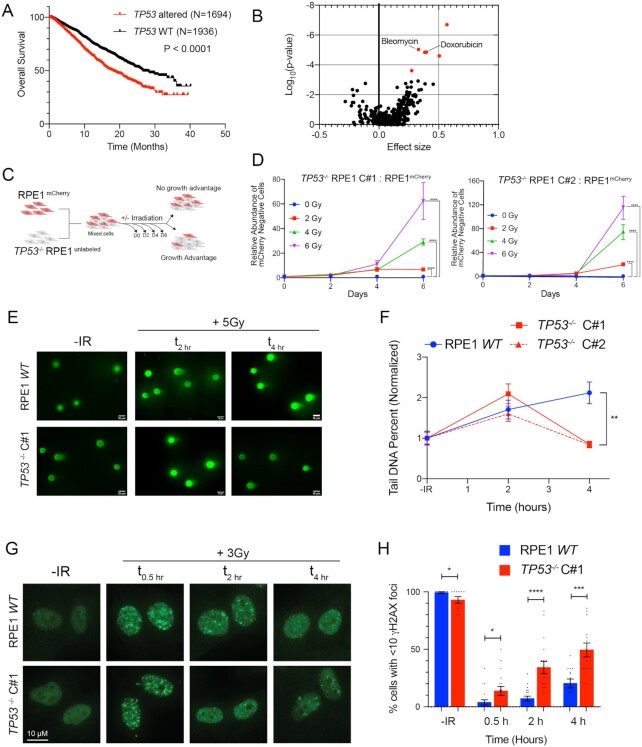
Figure 1.
p53-deficient cells exhibit radioresistance and accelerated resolution of DNA DSBs. (A) Kaplan–Meier overall survival analysis of patients from the MSK-IMPACT pan-cancer cohort, stratified by genetic alterations in the TP53 gene (WT vs. mutations or deep deletions). Data obtained from the cBioportal. P-value calculated using a two-sided log-rank test. (B) Association between TP53 mutation and drug sensitivity from the Genomics of Drug Sensitivity in Cancer database. P-values were calculated using ANOVA and a threshold of P < 10−3 and a false discovery rate threshold of 25% were used to indicate statistically significant associations (labeled in red). (C) Diagram of growth competition assay. mCherry-labeled RPE1 cells were mixed with unlabeled TP53−/− RPE1 (1:1), exposed to IR and grown for 6 days. (D) Relative abundance of unlabeled TP53−/− Clone#1 (left panel) or TP53−/− Clone#2 (right panel) measured by Intellicyte high-throughput cytometry ± standard error of the mean (SEM, n = 6) is shown, normalized to the untreated (0 Gy) cohort at each time point. (E) Representative neutral COMET fluorescence staining for measurement of DNA DSBs in cells with indicated genotypes treated without or with 5 Gy IR evaluated at the indicated time points. (F) Quantification of neutral COMET tail DNA percentage, normalized to the untreated baseline, in RPE1 WT (blue) and two TP53−/− RPE1 cell lines (red). Data shown are mean values (n = 50–150 cells per treatment condition) ± SEM, and are consistent across three independent biological replicates. (G) Representative immunofluorescence images of γH2AX foci in cells with indicated genotypes untreated (no IR) or collected 0.5, 2 and 4 h after IR (3 Gy). (H) Percentage of cells with <10 γH2AX foci at the different time points in RPE1 WT (blue) and TP53−/− RPE1 (red). Data shown are mean ± SEM across three independent biological replicates. *P < 0.05, **P < 0.01, ***P < 0.001 and ****P < 0.0001 by two-tailed Student’s t-test.

