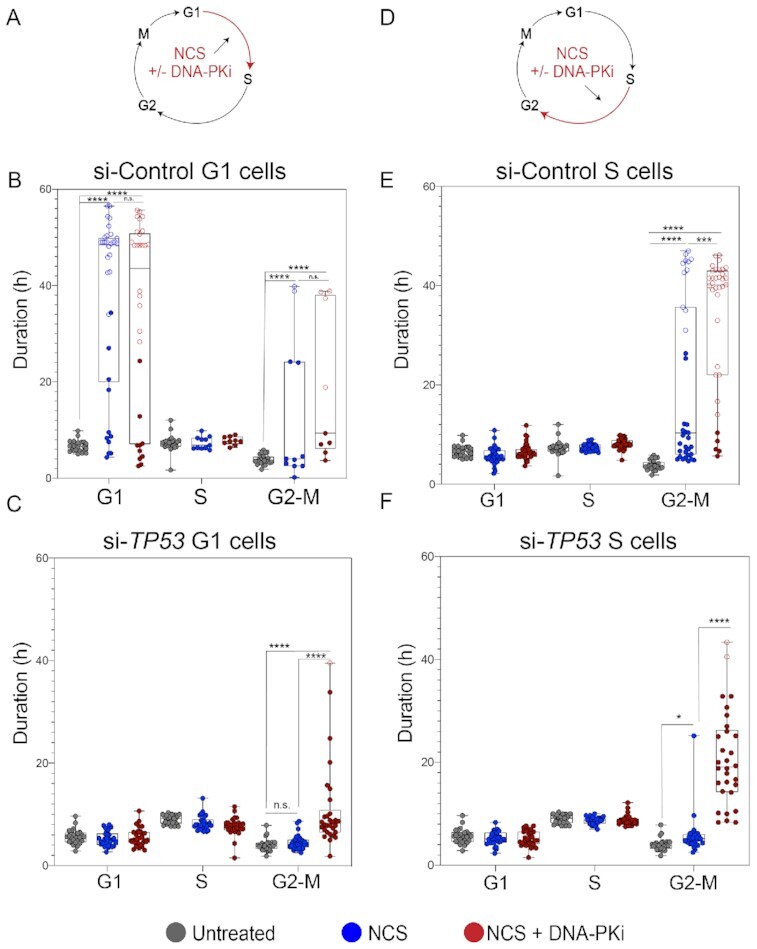
Figure 3.

Checkpoint responses halt p53-proficient cells upon exposure to NCS while p53-deficient cells continue to cell cycle despite NCS exposure. (A) Schematic depicting NCS treatment (100 ng/ml) and/or NCS + 0.5 μM DNA-PKi (NU7441) treatment, and phase of the cell cycle cells exposed to drug (G1). (B) Distribution of cell cycle phase lengths; each colored dot is an individual cell with untreated cells (no NCS) shown in gray, NCS-treated cells shown in blue and NCS + 0.5 μM DNA-PKi-treated cells shown in red for si-Control RPE1 in G1 phase. n = 20 untreated and n = 30 treated cells (for each treatment cohort). Statistical significance was determined by comparing untreated and treated groups at each phase: ****P < 0.0001 and n.s. = non-significant. Open circles indicate arrested cells that did not enter the subsequent phase of cell cycle for remainder of imaging. (C) Distribution of cell cycle phase lengths for si-TP53-treated RPE1 in G1 phase: ****P < 0.0001 and n.s. = non-significant as evaluated by two-tailed t-test. (D) Schematic of drug treatment for cells in S phase. (E) Distribution of cell cycle phase lengths for si-Control treated RPE1 in S phase: ***P < 0.001, ****P < 0.0001 and n.s. = non-significant as evaluated by two-tailed t-test. (F) Distribution of cell cycle phase lengths for si-TP53-treated RPE1 in S phase: ****P < 0.0001 and n.s. = non-significant as evaluated by two-tailed t-test.
