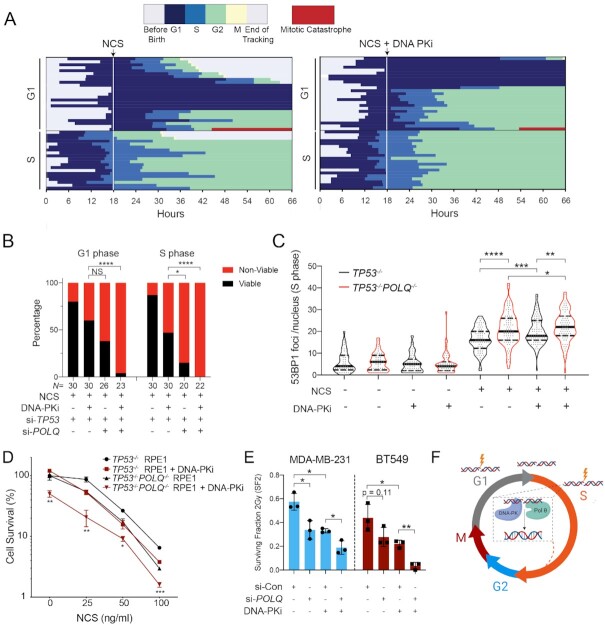
Figure 6.
Pol θ promotes resistance to radiomimetic therapy in p53-deficient cells by suppressing S-phase DSBs. (A) Horizontal bar plots depicting cell cycle outcomes for si-TP53 + POLQ RPE1 cells treated with 100 ng/ml NCS (left panel) or 100 ng/ml NCS plus 0.5 μM DNA-PKi (NU7441) (right panel). Each row represents an individual cell, and the cells are organized according to cell cycle state at the time of drug addition (G1 versus S). (B) Analysis of cell fate outcomes categorized as viable (i.e. successful completion of mitosis) versus non-viable (arrest or mitotic catastrophe). Fisher’s exact two-tailed test: *P < 0.05 and ****P < 0.0001. (C) Violin plots of 53BP1 foci counts per nucleus in TP53−/− (black) and TP53−/−POLQ−/− (red) RPE1 cells, 4 h after treatment with 100 ng/ml NCS with or without 0.5 μM DNA-PKi. Data shown are for S-phase cells, which were identified by a 30-min EdU pulse at the time of drug addition. The violin plots show the median (solid black line) and quartiles (dashed lines). Statistical significance assessed with Student’s two-tailed t-test: ***P < 0.001 and ****P < 0.0001. (D) Colony forming efficiency assay evaluating TP53−/− and POLQ−/−TP53−/− RPE1 after treatment with NCS (at 25, 50 and 100 ng/ml) with or without 0.5 μM DNA-PKi. Cell survival is normalized to the untreated control for each genotype, and the bar graph depicts mean ± SEM (n = 3). Statistical significance of TP53−/− versus TP53−/−POLQ−/− genotypes assessed with Student’s two-tailed t-test: ***P < 0.001, **P < 0.01 and *P < 0.05. (E) Surviving fraction after 2 Gy IR as determined by the colony forming assay in MDA-MB-231 (left) and BT-549 (right) TP53-mutant breast cancer cell line models. Cells were pretreated with si-Control or si-POLQ for 48 h prior to irradiation without or with DNA-PKi (0.5 μM NU7441). Statistical significance assessed with Student’s two-tailed t-test: *P < 0.05 and **P < 0.01. (F) DNA-PK and Pol θ independently promote repair of therapy-induced S-phase DNA DSBs, which promotes therapeutic resistance in p53-deficient cells.

