Figure 8.
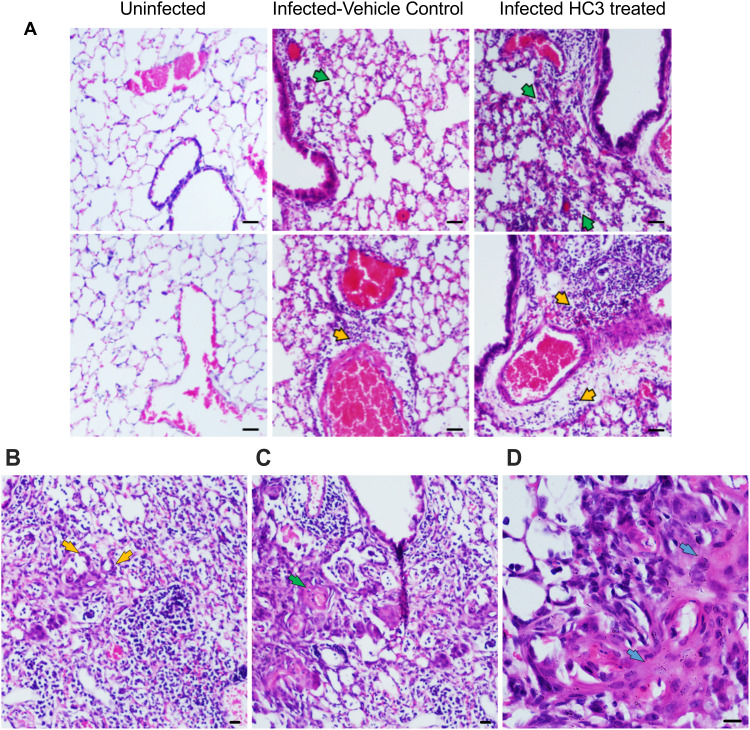
Histological Analysis of Recovery. (A) Representative images of H&E-stained sections of lung tissue at 10× (scale bar 100µm) magnification from healthy animals, infected vehicle control animals, and infected HC3-treated animals (d15 post infection) from left to right. Lungs from influenza-infected control animals display mild/moderate multifocal perivascular mixed infiltrate (yellow arrow) and alveolar/interstitial mixed infiltrate of lymphocytes and neutrophils (green arrow). Influenza-infected animals treated with HC3 show moderate perivascular (yellow arrow) as well as alveolar/interstitial mixed infiltrate of lymphocytes and neutrophils (green arrow). (B–D) Infected HC3-treated lung tissue exhibit multifocal type 2 pneumocyte proliferation (yellow arrow), mild multifocal squamous cell metaplasia (green arrow), and mild fibroplasia (blue arrow).

