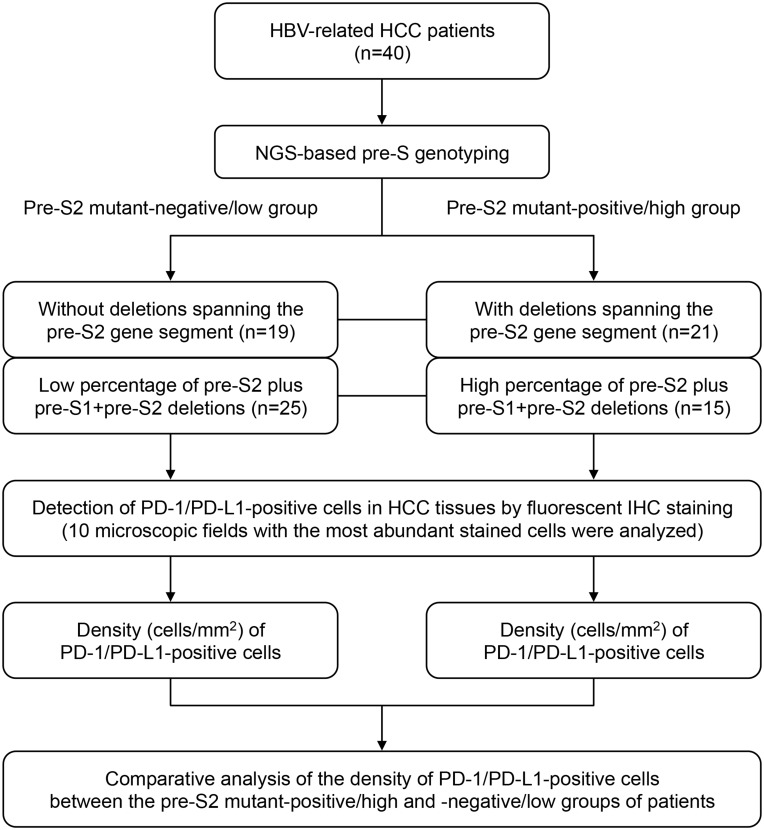
Figure 1.
Flowchart for patient classification by pre-S genotyping and quantitative analysis of PD-1/PD-L1-positive cells in HCC tissues in this study. First, by the NGS-based pre-S genotyping, HBV-related HCC patients were classified into two groups, the pre-S2 mutant-positive/high and -negative/low groups, in terms of either the presence of deletion spanning pre-S2 gene segment or the percentage of pre-S2 plus pre-S1+pre-S2 deletion. Next, the PD-1/PD-L1-positive cells in HCC tissues were detected by fluorescent IHC staining and were further quantified as the density of PD-1/PD-L1-positive cells. Finally, the density of PD-1/PD-L1-positive cells in HCC tissues between the two groups of patients was comparatively analyzed.

