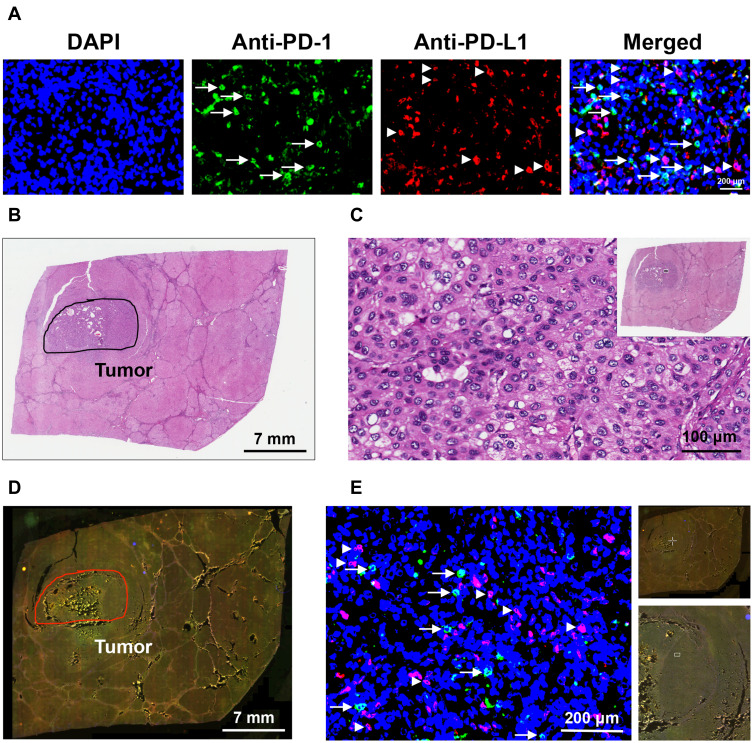
Figure 2.
Detection and quantification of PD-1/PD-L1-positive cells in HCC tissues. (A) Liver tissues of HBV-related HCC patients were double-stained by fluorescent IHC with antibodies against PD-1 (Anti-PD-1) and PD-L1 (Anti-PD-L1) to detect the cells expressing PD-1 (green in color) and PD-L1 (red in color), as indicated by white arrows and arrowheads, respectively, in the single-color and merged images. Nuclei were counterstained with DAPI (blue in color). Shown were representative results. Original magnification, ×40. Scale bar, 200 μm. (B) Histopathology of liver tissues was examined by H&E staining to define the tumor regions, as highlighted by the black circle. Shown was a representative whole-slide image. Scale bar, 7 mm. (C) Magnification of the outlined tumor region (white rectangle box in the top-right image with a smaller magnification) in the H&E-stained liver tissue section. Original magnification, ×40. Scale bar, 100 μm. (D) Whole-slide image of the liver tissue section stained by fluorescent IHC with PD-1 and PD-L1 antibodies. Tumor region was highlighted by the red circle. Shown was a representative merged image. Scale bar, 7 mm. (E) Magnification of the outlined tumor region (white crossed lines in the top-right image with the smallest magnification; white rectangle box in the down-right image with a smaller magnification) in the fluorescent IHC-stained liver tissue section. Cells stained positively with PD-1 (green in color) and PD-L1 (red in color) antibodies were indicated by white arrows and arrowheads, respectively. Nuclei were counterstained with DAPI (blue in color). Shown was a representative merged image. Original magnification, ×40. Scale bar, 200 μm.

