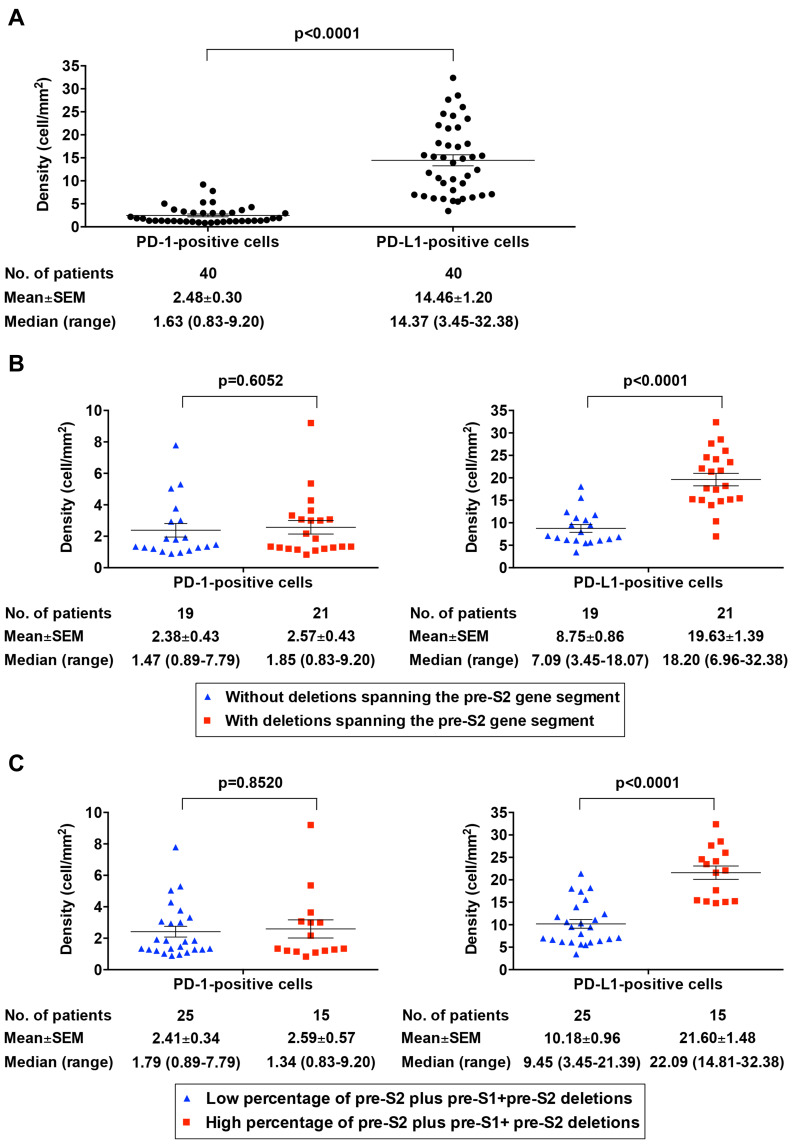
Figure 3.
Comparative analysis of the density of PD-1/PD-L1-positive cells in HCC tissues between the pre-S2 mutant-positive/high and -negative/low patients. (A) Density of PD-1- and PD-L1-positive cells in HCC tissues in total patients. (B) Density of PD-1-positive cells (left graph) and PD-L1-positive cells (right graph) in HCC tissues between patients with and without deletion spanning pre-S2 gene segment. (C) Density of PD-1-positive cells (left graph) and PD-L1-positive cells (right graph) in HCC tissues between patients with high and low percentage of pre-S2 plus pre-S1+pre-S2 deletion. Horizontal lines represented the mean values of the distribution. A P-value<0.05 was considered to indicate statistical significance.

