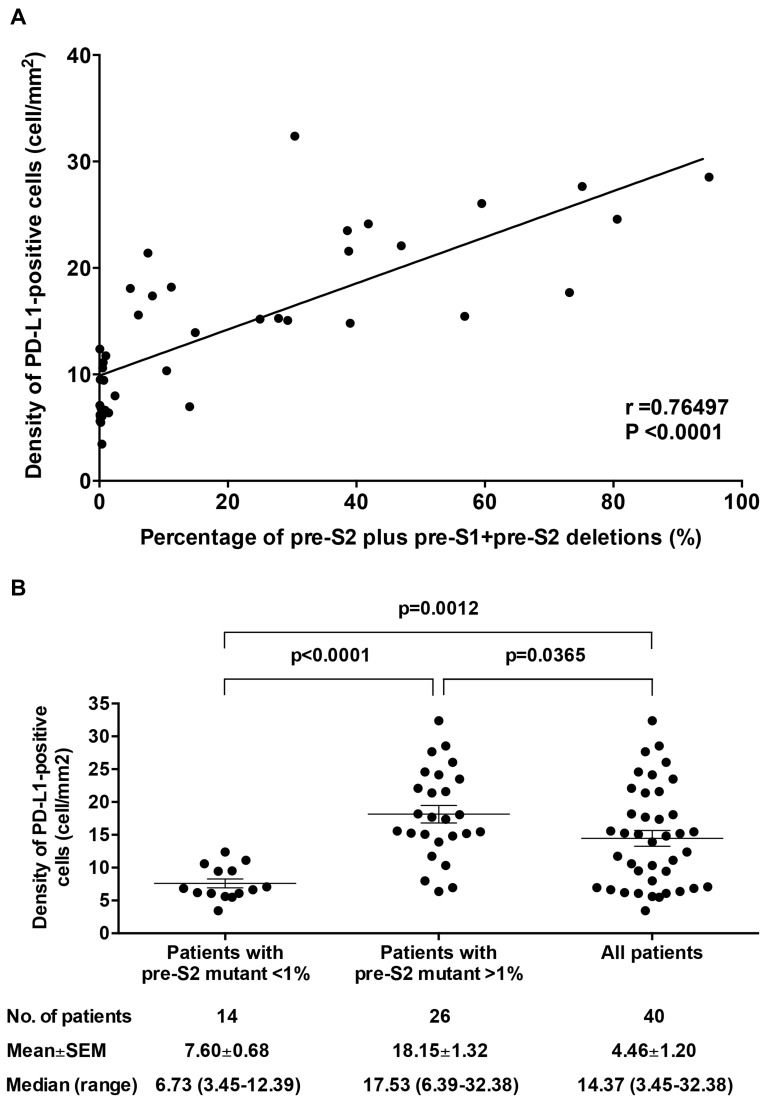
Figure 4.
Correlation between the percentage of pre-S2 plus pre-S1+pre-S2 deletion and the density of PD-L1-positive cells in HCC tissues. (A) The percentage of pre-S2 plus pre-S1+pre-S2 deletion was plotted against the density of PD-L1-positive cells in HCC tissues in 40 HBV-related HCC patients. The associated linear regression line was depicted. A Pearson’s correlation coefficient (r) between 0.7 and 0.9 denoted a high positive correlation. A P-value<0.05 was considered to indicate statistical significance. (B) Density of PD-L1-positive cells in HCC tissues of patients with the percentage of pre-S2 plus pre-S1+pre-S2 deletion (pre-S2 mutant) <1%, patients with the percentage of pre-S2 plus pre-S1+pre-S2 deletion (pre-S2 mutant) >1%, and all patients. Horizontal lines represented the mean values of the distribution. A P-value<0.05 was considered to indicate statistical significance.

