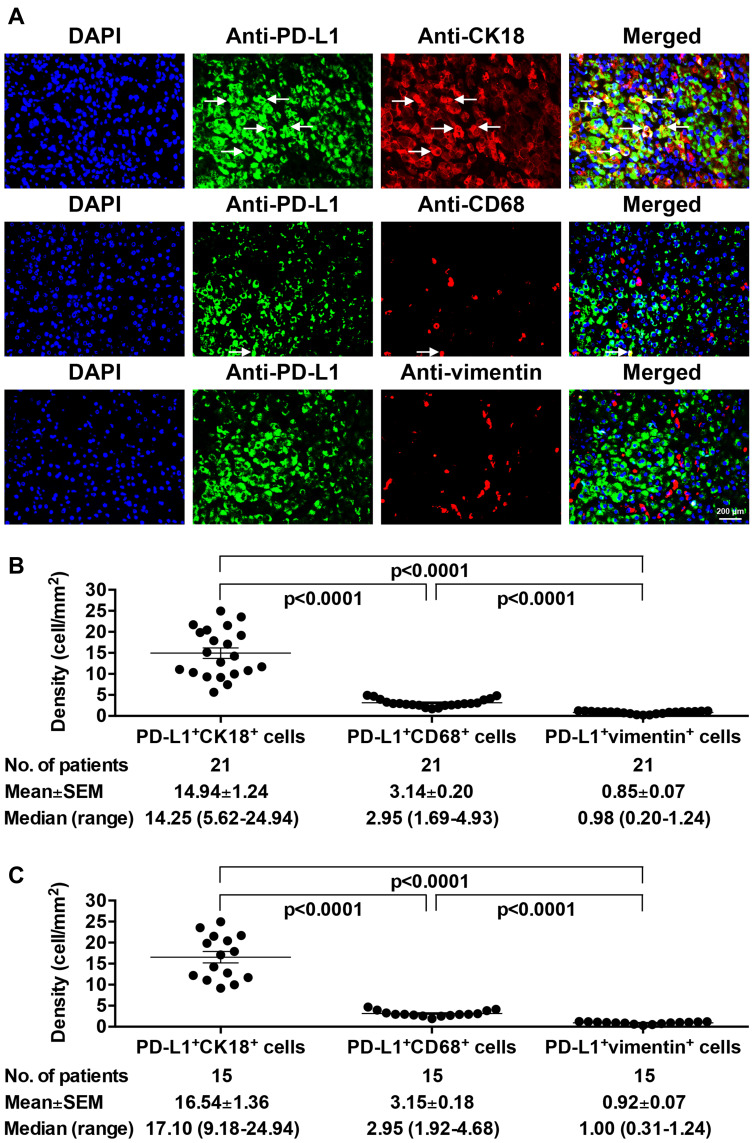
Figure 5.
Expression profiles of PD-L1 in different cell populations in HCC tissues of pre-S2 mutant-positive/high patients. (A) The expression of PD-L1 on tumor cells, Kupffer cells, and LSECs in HCC tissues of pre-S2 mutant-positive/high patients was detected by fluorescent IHC staining of PD-L1 (green in color) together with CK18 (red in color), CD68 (red in color), and vimentin (red in color), respectively. The HCC tumor cells and Kupffer cells with PD-L1 expression appeared yellow and were indicated by white arrows in the single-color and merged images. Nuclei were counterstained with DAPI (blue in color). Shown were representative results. Original magnification, ×40. Scale bar, 200 μm. (B) Density of PD-L1/CK18 double-positive (PD-L1+CK18+), PD-L1/CD68 double-positive (PD-L1+CD68+), and PD-L1/vimentin double-positive (PD-L1+vimentin+) cells in HCC tissues of patients with deletion spanning pre-S2 gene segment. (C) Density of PD-L1+CK18+, PD-L1+CD68+, and PD-L1+vimentin+ cells in HCC tissues of patients with high percentage of pre-S2 plus pre-S1+pre-S2 deletion. Horizontal lines represented the mean values of the distribution. A P-value<0.05 was considered to indicate statistical significance.

