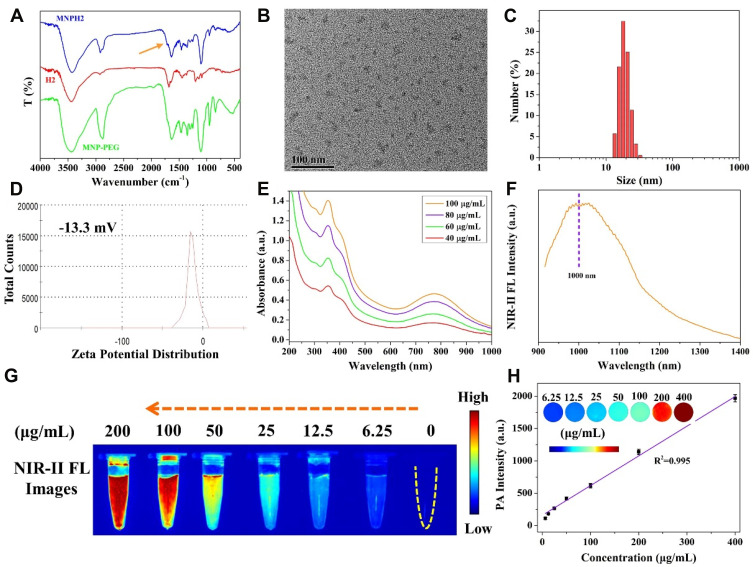
Figure 2.
Characterization of MNPH2. (A) FT-IR spectra of MNP-PEG, H2, and MNPH2. (B) TEM image of MNPH2. (C) DLS analysis of the hydration size distribution of MNPH2. (D) Zeta potential of MNPH2. (E) UV-vis-NIR absorbance spectra of MNPH2 with different concentrations (40, 60, 80, and 100 μg/mL). (F) NIR-Ⅱ fluorescence emission spectrum of MNPH2 upon 785 nm excitation. (G) NIR-II fluorescence images of MNPH2 with varying concentrations ranging from 0 to 200 μg/mL. (H) The linear relationship between concentrations and PA signals of MNPH2 (R2=0.995). Inset presented PA images of MNPH2 with different concentrations.

