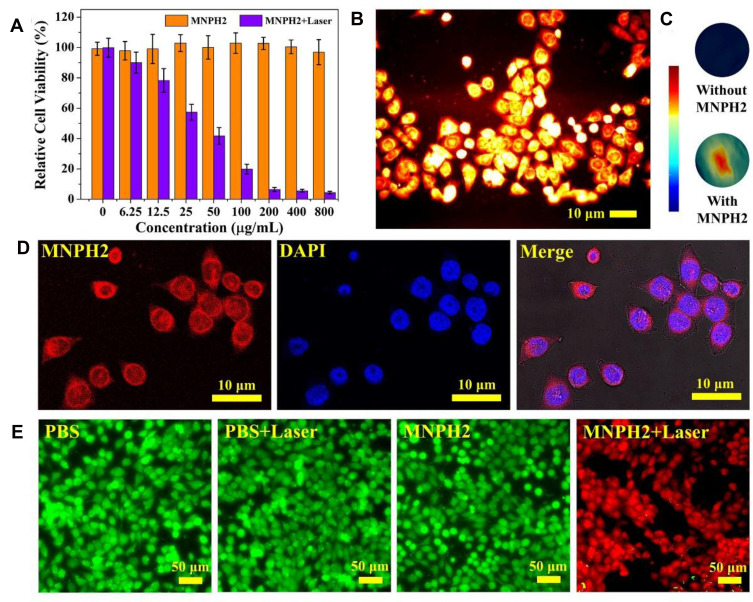
Figure 4.
Cell experiments. (A) Cell viability of Hep-2 cells incubated with various concentrations of MNPH2 with or without irradiation (808 nm, 0.75 W/cm2, 5 min). (B) NIR-II fluorescence images of Hep-2 cells treated with MNPH2 (100 μg/mL). Scale bar=10 μm. (C) PA images of Hep-2 cells treated without and with MNPH2 (100 μg/mL). (D) CLSM images for cell internalization. MNPH2 was red and the cell nucleus was stained blue. Scale bar: 10 μm. (E) Fluorescence images of Hep-2 cells stained with Calcein-AM (green for live cells) and PI (red for dead cells): PBS, PBS + Laser, MNPH2, and MNPH2 + Laser. Scale bar = 50 μm.

