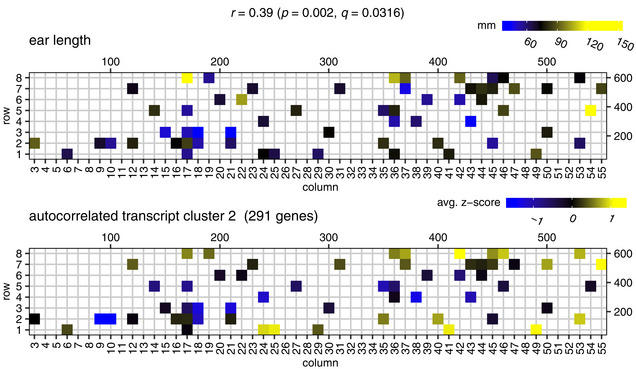
Figure 3. Gene expression patterns in cluster 2 correlate with ear length.

The top panel displays the ear length phenotype on the field (only for plants that were transcriptome profiled). The bottom panel displays the average z‐scored gene expression profile of spatially autocorrelated gene cluster 2 (291 genes), mapped to the field. Shown on top are the Pearson’s correlation (r) between the cluster 2 expression profile and ear length, the corresponding P‐value (computed using cor.test in R) and the corresponding q‐value (computed using the Benjamini–Hochberg method on all comparisons of cluster gene expression profiles with the ear length profile). The scales on the top and to the right of the field maps give field plot dimensions in cm.
