
Figure 4. Example ENIGMA module learned from the single‐plant transcriptome dataset.
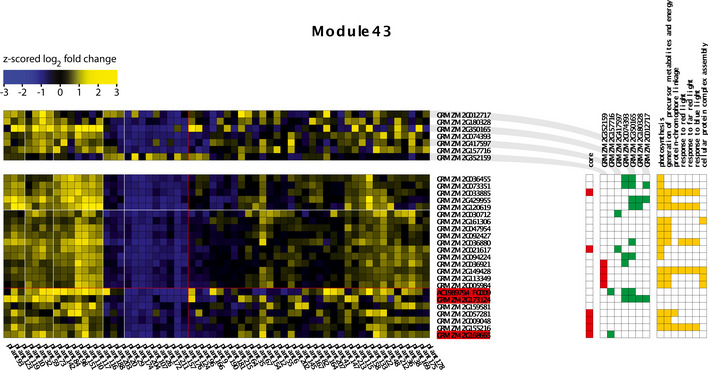
The bottom yellow/blue grid shows the expression profiles of the module genes, while the top grid contains the expression profiles of predicted regulators of the module. Yellow/blue squares indicate higher/lower gene expression with respect to the average expression of a gene across plants (black). Color hues are based on z‐scoring the log2 expression fold changes of genes (with respect to their average expression) across the entire dataset. Significant co‐differential expression links between the regulators and the module genes are indicated in the red/green matrix to the right (green = positively correlated, red = negatively correlated). Gene names highlighted in red indicate regulators that are part of the module. Genes indicated as core genes belong to the original module seed, and other genes were accreted by the seed in the course of module formation (Maere et al., 2008). Enriched GO categories in the module gene set are displayed on the right, with orange squares depicting which module genes are annotated to these GO categories. This particular module is significantly enriched (q ≤ 0.01) in known photosynthesis genes.