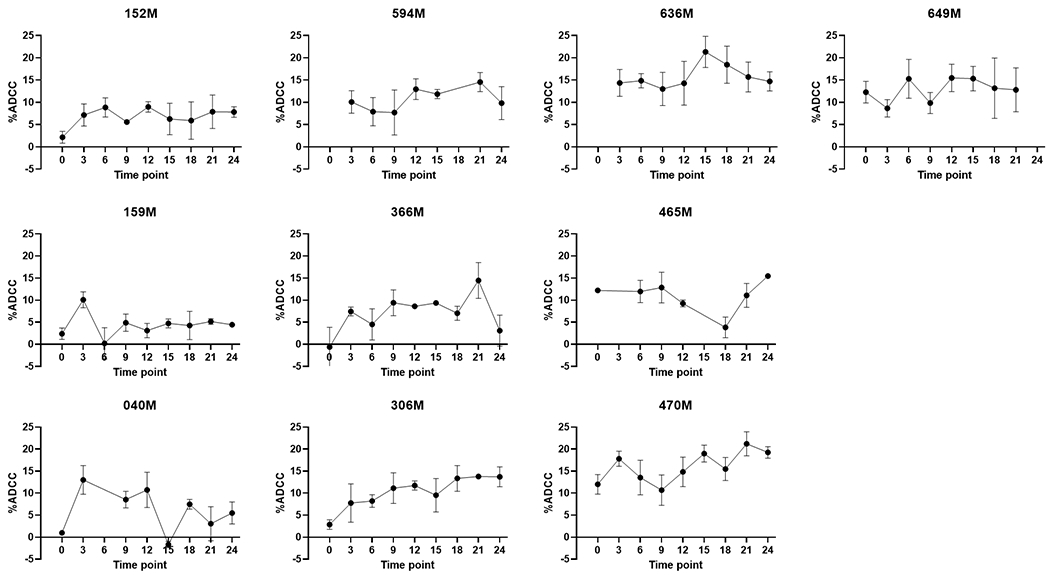
Figure 6.

Variation in ADCC activity over time. The longitudinal ADCC activity profiles for 10 individuals are shown. ADCC activity is on the y-axis, while follow-up time point (in months) in on the x-axis. The enrollment sample is represented as time point 0. Each point represents the mean and standard deviation of 3 independent experiments. Time points are without a dot when no sample was available for testing.
